Trading with the Donchian Channel Indicator

5 minutes for reading
In this review, we will get acquainted with a quite simple and useful indicator called Donchian Channel. This is the indicator that the famous Turtle trend strategy is based on.
How does the Donchian Channel work?
The Donchian Channel is quite a simple channel indicator reflecting the borders of price fluctuation in a preset time interval. The indicator was named after its creator, a famous exchange trader of Armenian origin Richard Donchian.
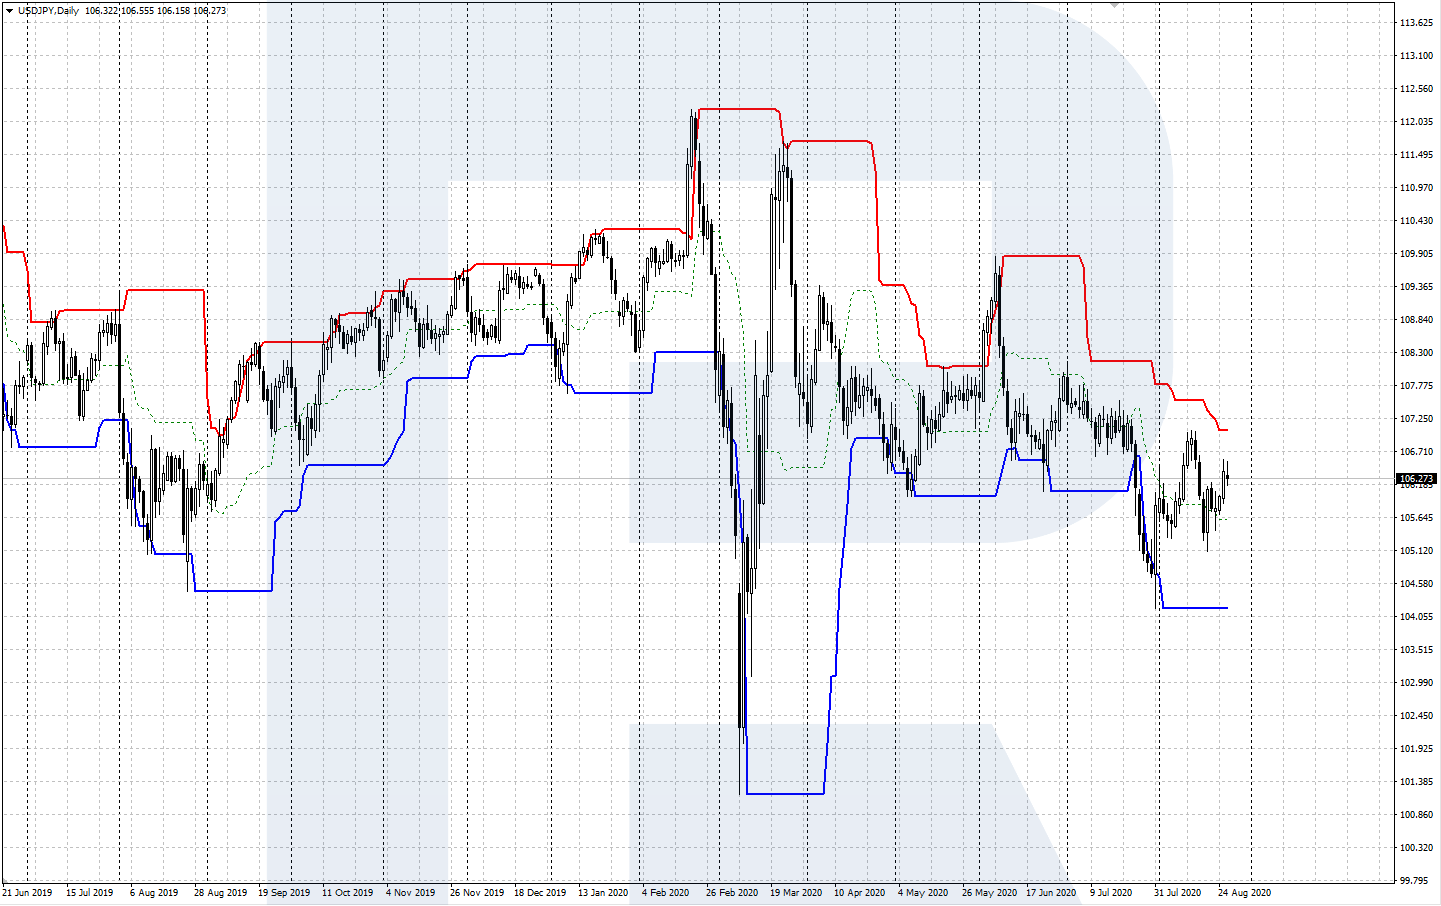
The indicator looks like a price channel with an upper and lower borders, inside which the quotation fluctuate. To draw a border, the Donchian Channel calculates the latest extremes, taking the highest high and the lowest low of the period.
The indicator acquired popularity after a trend strategy called Turtle Trading System was based on it. This famous strategy by Richard Dennis uses a breakaway of the Donchian Channel’s border with the period of 20 days as the entry point. A group of beginner traders demonstrated good results following this strategy.
In essence, the Donchian Channel may be called an indicator of volatility because it is based on calculating the price range based on recent highs and lows. The wider the channel, the higher the current volatility; when the channel narrows down, the volatility of the instrument temporarily decreases.
Installing and setting up the indicator
The Donchian Channel is included not in every trading terminal; hence, you might need to download a file of the indicator and set it up in your terminal. You can download the indicator for MetaTrader 4 by a link in the end of this article.
To install the indicator, copy the file to the Indicators folder. Via the Main Menu, open File/Open data catalog/MQL 4/Indicators, copy the file, and restart the terminal.
As a result, the Donchian Channel will appear on the list of user indicators and will become available for the charts of your instruments: open Insert/Indicators/User/Donchian Channel. Or just left-click the indicator in the Navigate window and drag to the chart.
The calculations are quite simple:
- Upper Line (border) = High (n, n) – the highest high of n periods
- Lower Line (border) = Low (n, n) – the lowest low of n periods
- Middle Line = (Upper Line + Lower Line) / 2 is the arithmetic mean of the channel borders, almost never used in practice.
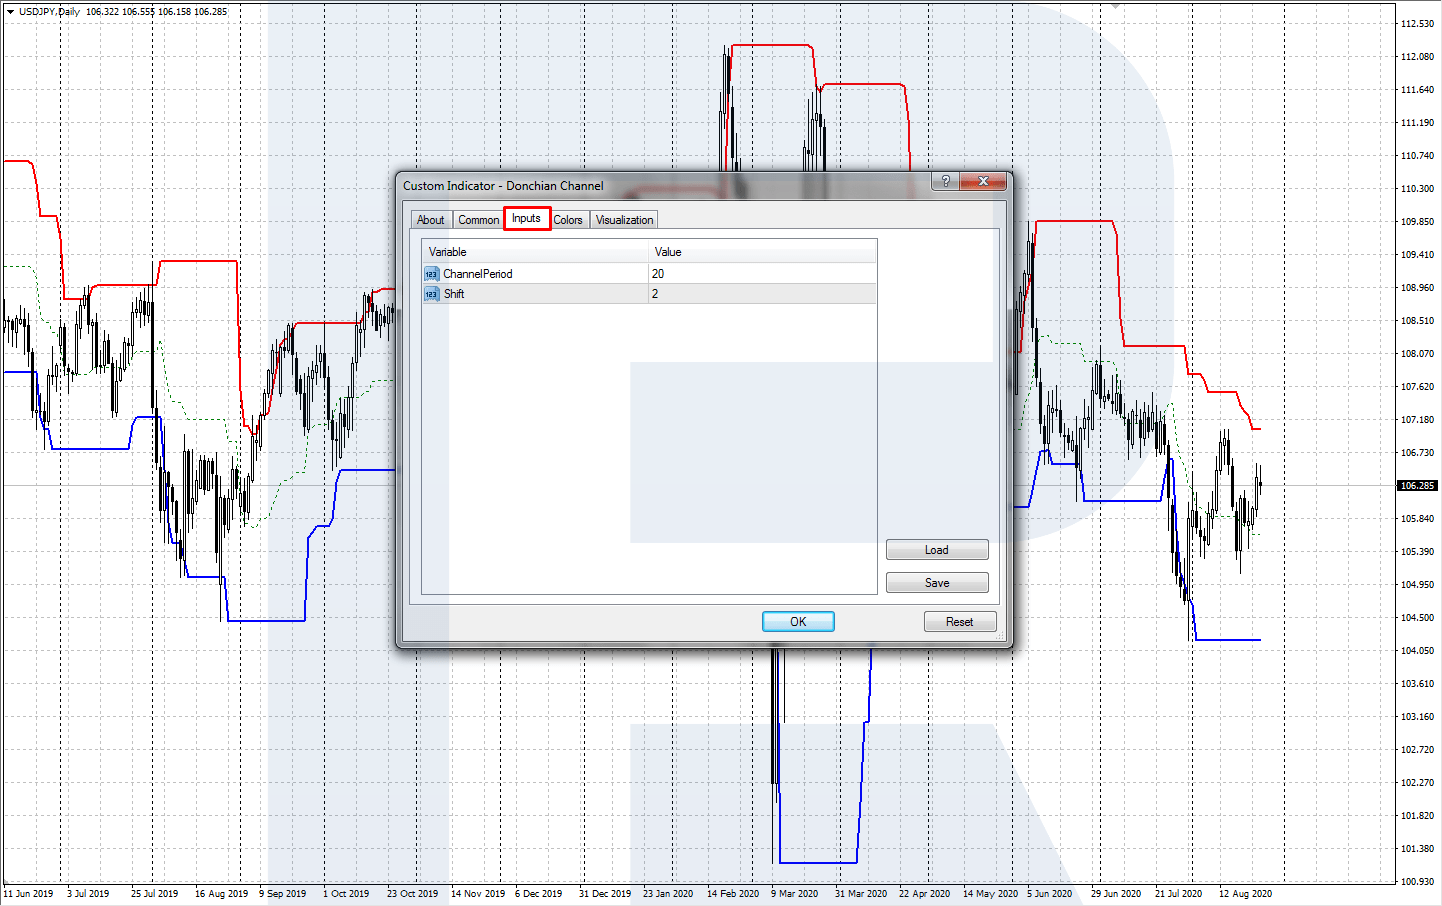
The following settings are customizable:
- The Period of the indicator: the number of candlesticks by which channel borders are calculated; the default setting is 20;
- The Shift of the channel to the right of the price channel (used for better visualizing the signals); the default setting is 2;
- The Colors and the style of the indicator lines.
Trading by the indicator
There are two main strategies of trading by the Donchian Channel: trading the trend and trading false breakaways.
Trading the trend
This is a classical way of trading the trend with the Donchian Channel used in the Turtle strategy by Richard Dennis. The strategy presumes opening trades by the actual trend when the 2—days high/low is broken away. The strategy is applicable to markets where lengthy directed trends are frequent (such as stock markets).
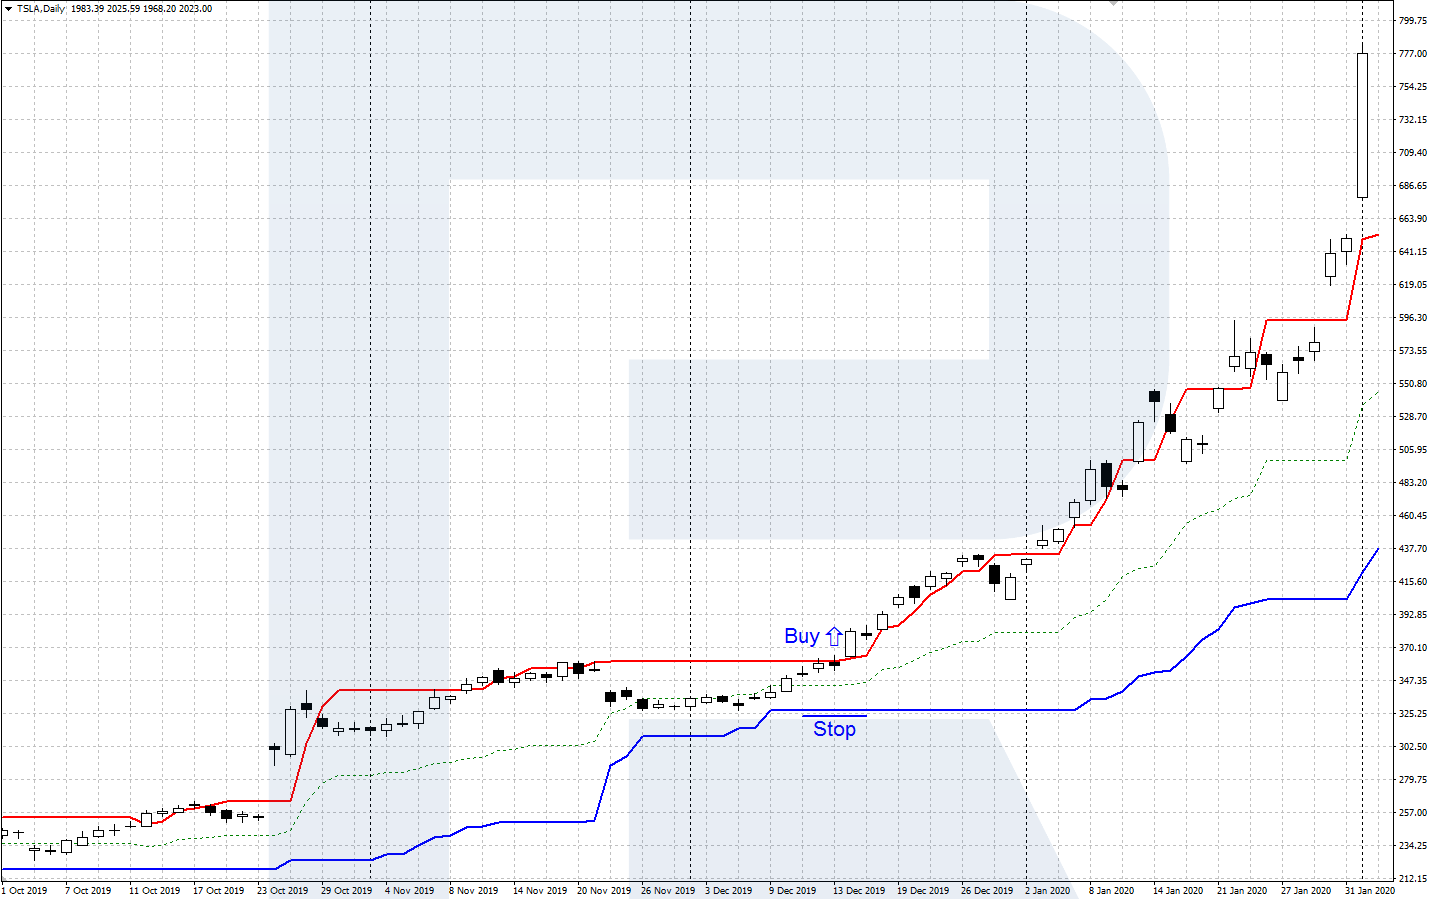
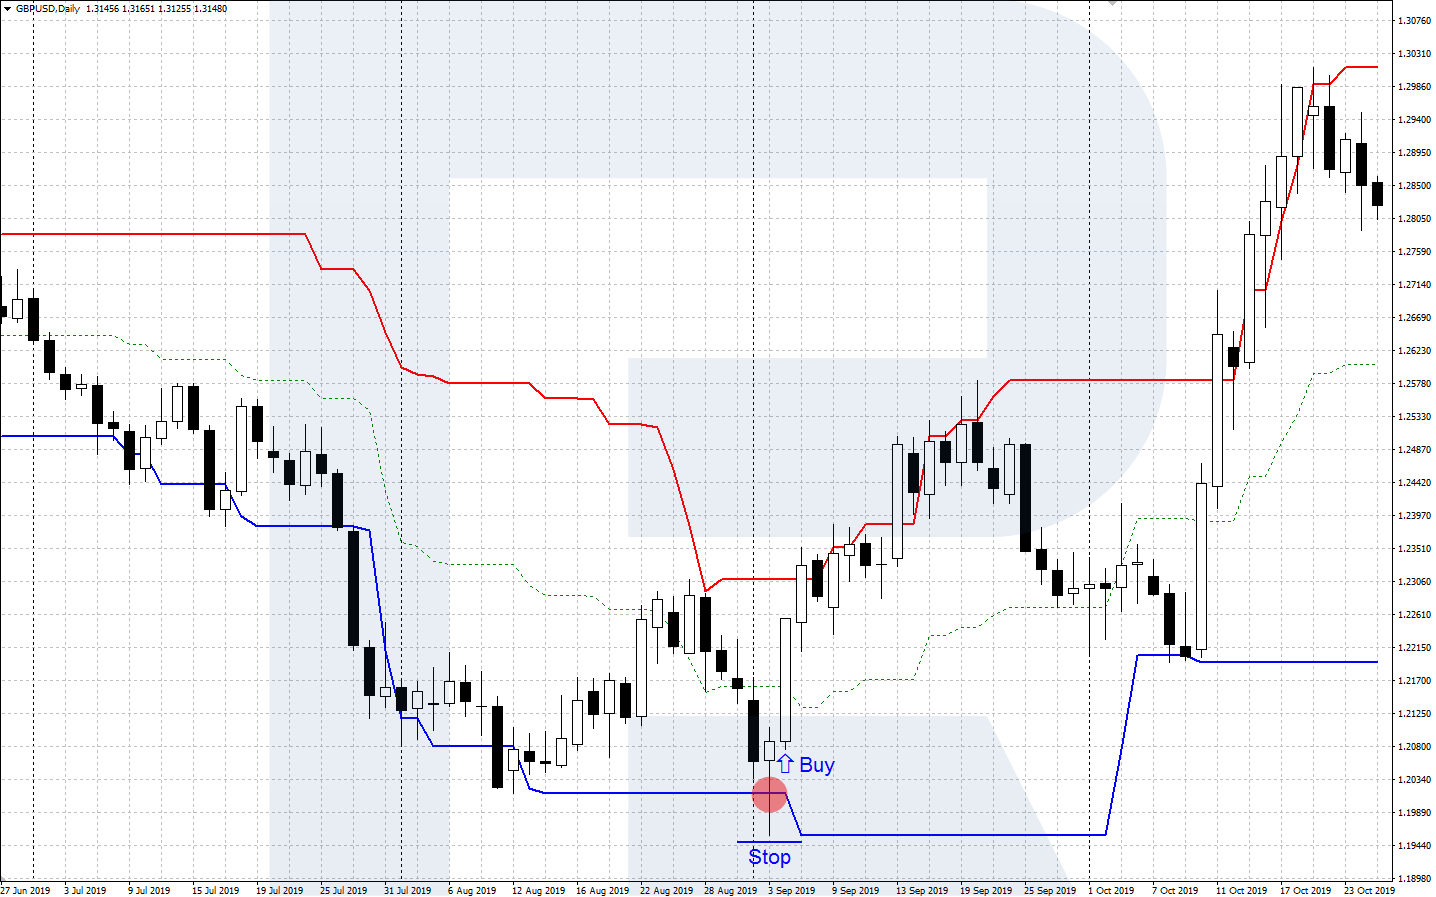
Signal to buy
- The price is moving in an uptrend or a flat;
- The daily candlestick closes above the upper border of the channel;
- Open a buying position on the next candlestick;
- Place a Stop Loss behind the lower border of the channel or the local low. Later on, move the SL upwards after the trend;
- Take Profit when you notice clear signs of a trend reversal.
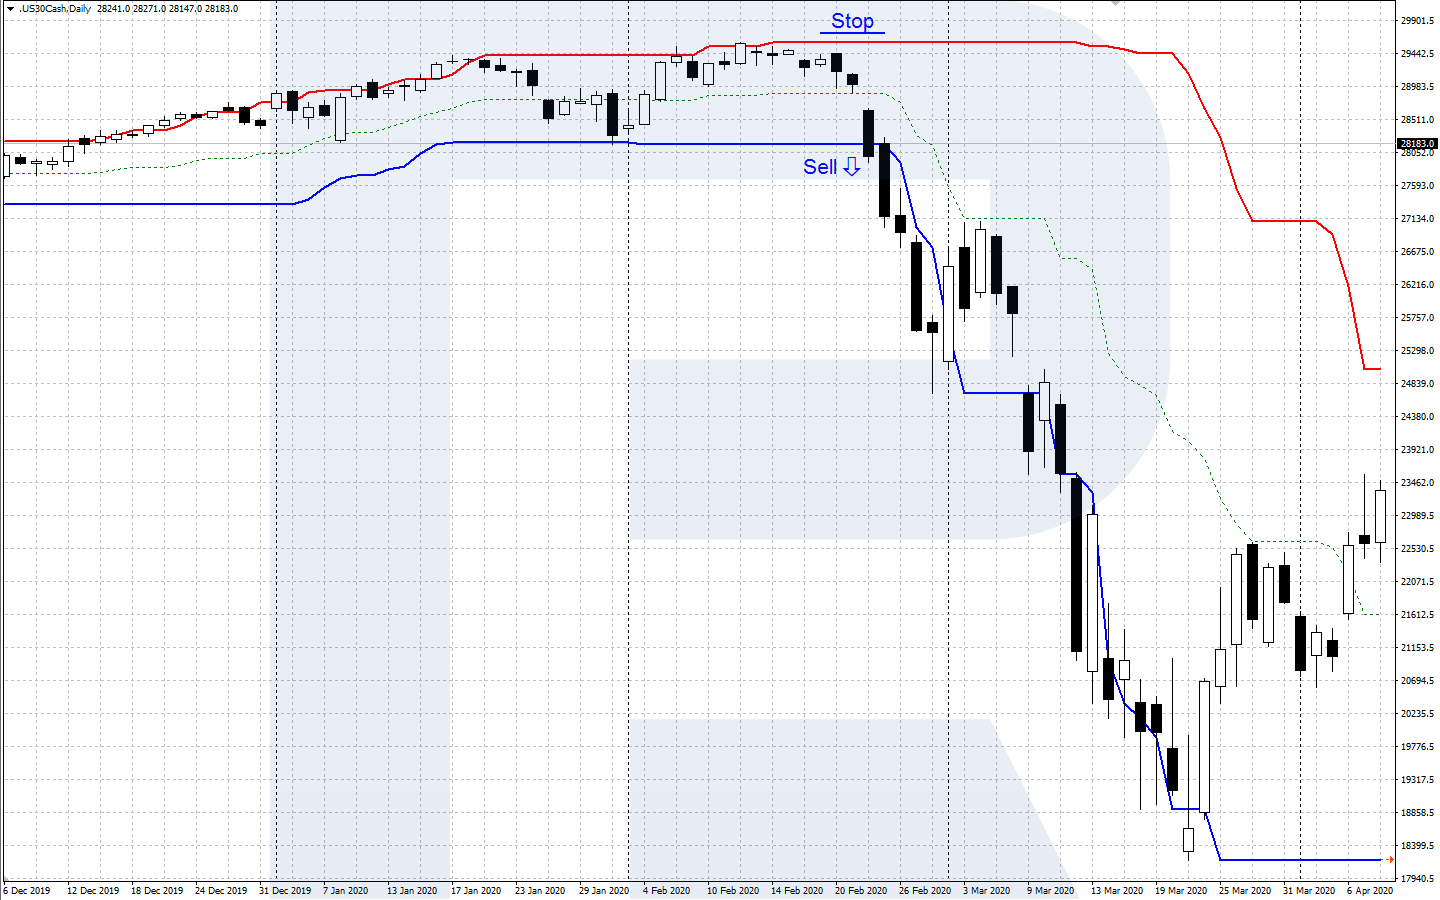
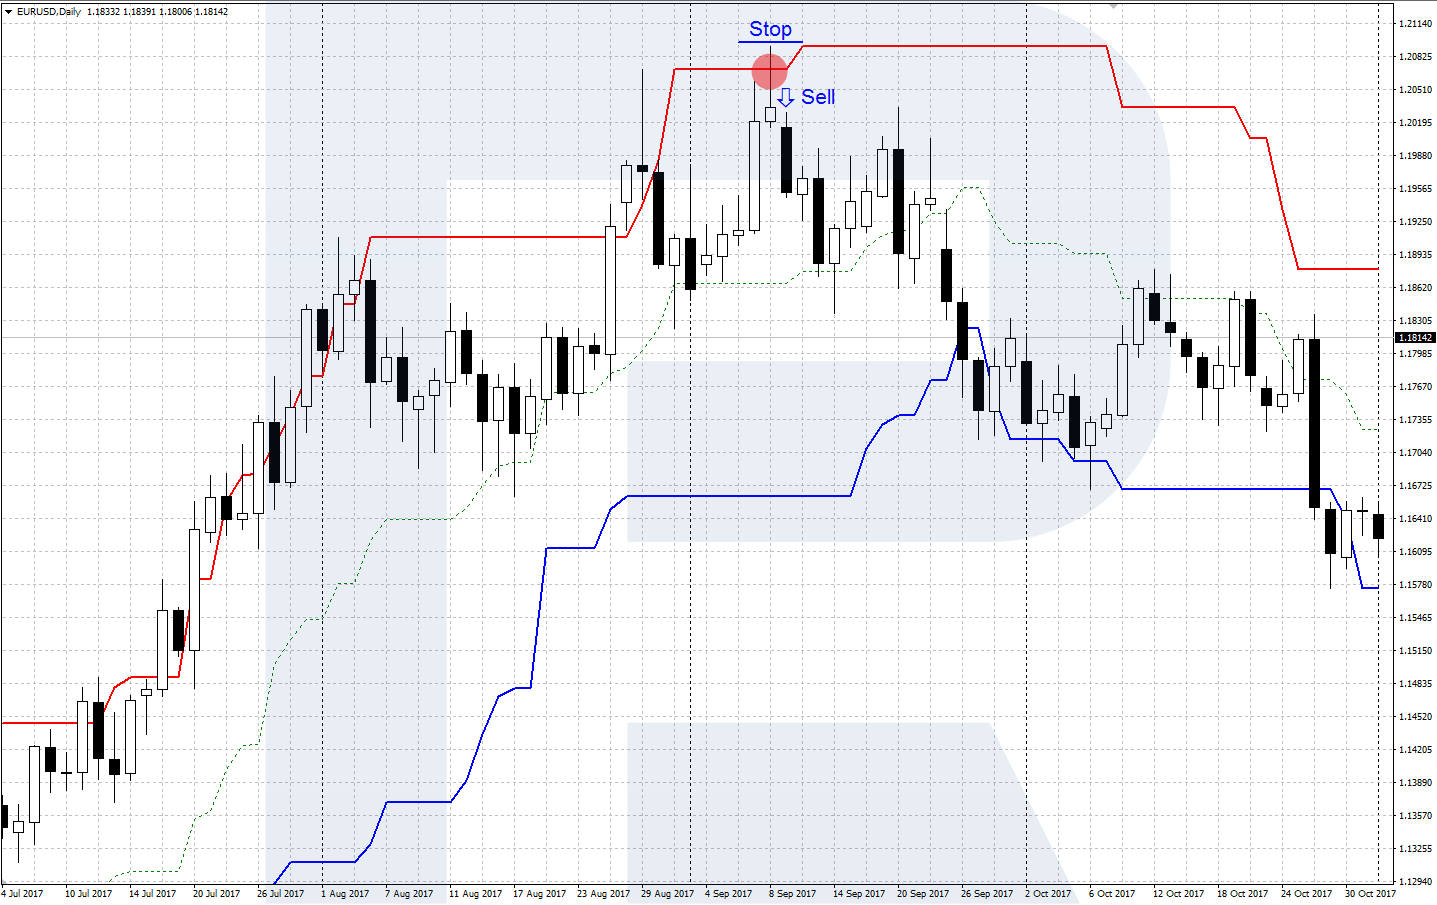
Signal to sell
- The price is moving in an downtrend or a flat;
- The daily candlestick closes below the lower border of the channel;
- Open a selling position on the next candlestick;
- Place a Stop Loss behind the upper border of the channel or the local high. Later on, move the SL downwards after the trend;
- Take the profit when you notice some signs of a trend reversal.
False breakaways
This is a counter-trend strategy that presumes trading false breakaways of 20-days highs/lows. This is the principle that underlies the Turtle Soup strategy by a famous stock expert Linda Bradford Raschke. This strategy is mostly applicable to frequently reversing markets (Forex, futures).
Signal to buy
- The daily chart breaks away the lower border of the channel but closes above it inside the channel, leaving a long “spike” at the place of the breakaway;
- Open a buying position on the next candlestick;
- Place an SL below the low of the false breakaway – slightly below the spike;
- Take the profit at the upper border of the channel when the Stop/Profit ratio is comfortable for you, or when you see clear signs of a reversal of the ascending price impulse.
Signal to sell
- The daily chart breaks away the upper border of the channel but closes below it inside the channel, leaving a long “spike” at the place of the breakaway;
- Open a selling position on the next candlestick;
- Place an SL above the high of the false breakaway – slightly above the spike;
- Take the profit at the lower border of the channel when the Stop/Profit ratio is comfortable for you, or when you see clear signs of a reversal of the descending price movement.
Summary
The Donchian Channel is a quite simple and helpful indicator. It is a good supplement to tech analysis that demonstrates the range of price movements on the chart during a set time interval. On the breakaway of the 20-days price channel two famous strategies are based: the Turtles by Richard Dennis and the Turtle Soup by Linda Raschke.