This trading method, created by Ken Wood, is a very simple system. It is even said that for using this method successfully, trading by the rules suggested by the author is enough.
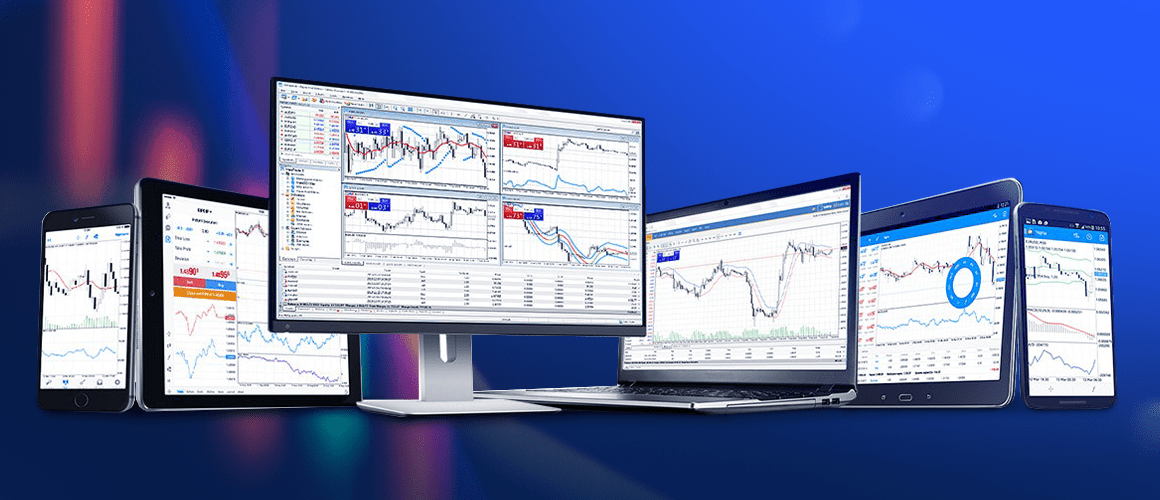
The truth is that MT5 features many more interesting functions that help in trading while MT4, to my mind, has too many limitations. Let us discuss some of them.
In this review, we will discuss the Relative Strength Index (RVI) indicator. It helps define the dynamics of the price change of a financial instrument on a certain period.
OsMA (Moving Average of Oscillator) is an oscillator based on the difference between two Exponential Moving Averages and their normalized values.
It has been a week since I posted my previous article but the S&P 500 stock index has managed to decline from 2800 to the low of 2475. On the whole, since February 20th, the decrease in the S&P 500 has amounted to 28%, which is the greatest decline of the index in the last 10 years. The current situation can easily be called a crisis, and its reason is not some overheated economy or a bubble in some sector but a virus.
Andrew's Pitchfork is an instrument of graphic analysis based on the middle trendline and an equidistant channel. Unfortunately, this method of trading and analysis is not very popular among traders; however, it seems to be perfect for drawing a channel quickly and trading bounces off and breakouts of its borders.
In this review, we will discuss an interesting technical indicator CCI (Commodity Channel Index). This indicator helps to find an approaching correction or reversal on the price chart.
Synergy strategy may be used not only on Forex but also on futures and stock markets if there are indicators for the respective trading terminals.
Coronavirus keeps threatening the world economy. The S&P500 index is again trading near its recent lows: by the moment this article is published, it will most probably have broken the support level at 2,850 USD and go on declining.
The Turtle system features clear rules of entering and exiting the market, understandable to beginners. It is important to comply with them strictly, as well as with the market management rules, such as the risk of 1-2% per trade.
Today I would like to suggest considering a trading idea to sell EUR/USD and Apple (NASDAQ: AAPL) stocks.
The Heiken Ashi (translated as "middle candlestick") indicator is just another way of representing the price chart as candlesticks, different from the popular Japanese candlesticks. In essence, it is an alternative way of drawing a price chart by averaging. The Heiken Ashi indicator is featured by many popular trading terminals, including MetaTrader 4 and MetaTrader 5.
The time has come for coronavirus to influence the quotations of stock indices as well. While a month ago these were just rumors, now investors are seriously worried about the probable troubles of Chinese companies.
In this article, we will speak about the inner structure and the peculiarities of market waves. We will discuss the multilevel model of the market cycle and its consistent parts – subwaves of various complexity and levels.
In this review, we will discuss a popular indicator called ZigZag. This indicator makes it easier to interpret charts, showing important price changes, and helps to carry out tech analysis.

