What Should a Trader Know About the Williams' Percent Range?
9 minutes for reading
The Williams' Percent Range indicator was developed by a famous trader Larry Williams in 1973. This indicator is meant for identifying oversold and overbought areas on the market.
Indicator description
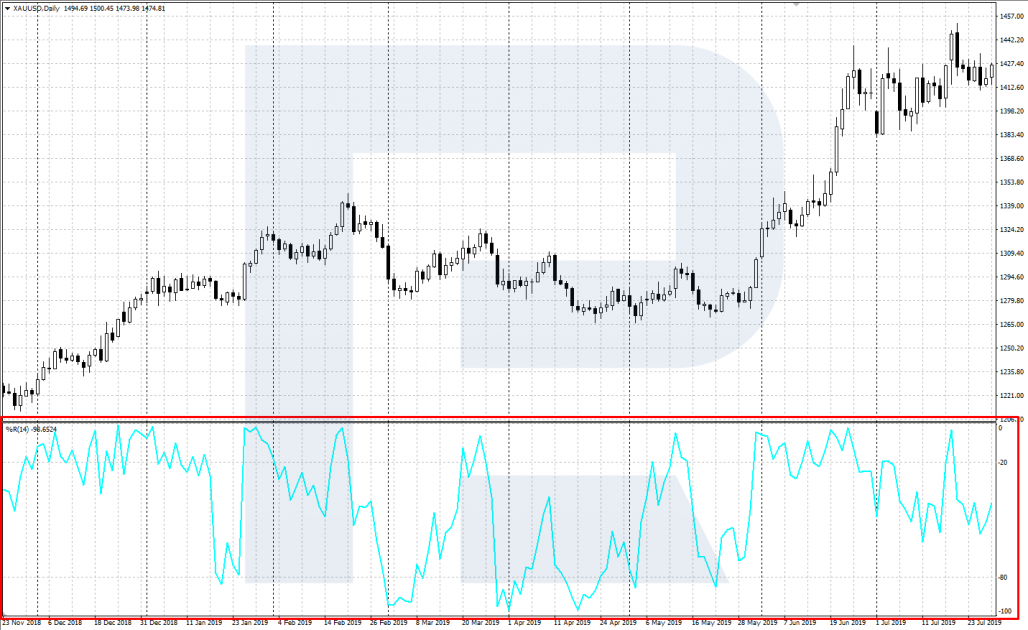
The Williams' Percent Range (Williams %R) is an oscillator of the price movement speed showing the position of the current price in the range between the low and high of the previous periods. The indicator is drawn in a separate window under the price chart and consists of the main line %R and two areas: the overbought and oversold ones.
The indicator values vary form 0% to -100%; through the levels of -20% and -80% signals lines are drawn, meaning the oversold (from -80% to -100%) and overbought (from 0% to -20%) areas.
The Williams %R compares the closing prices to the set price range and shows whether the buyers can close the price near to the high, or whether the sellers are stronger and will manage to close the price at the low.
If the buyers fail to close the price near the highs in an uptrend, this means they are weaker than it seems, and sells become possible. If the sellers fail to close the price at the lows in a downtrend, this means their strength is fading, and buys might follow.
WPR history and settings
Many argue that he was, indeed, the author, but for us, this is rather irrelevant: whoever created the indicator, this does not change its work principle.
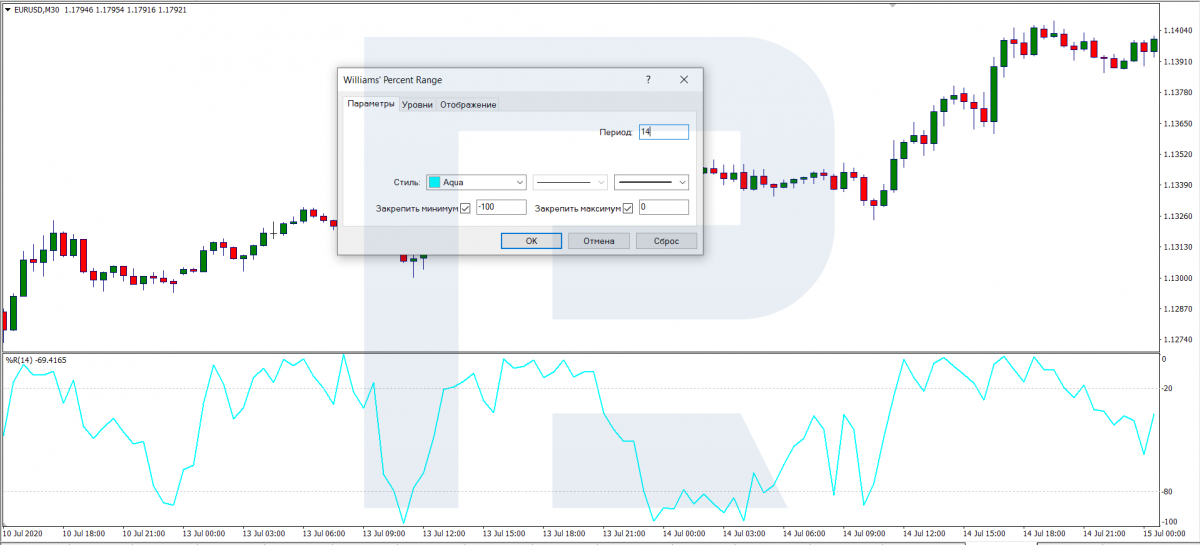
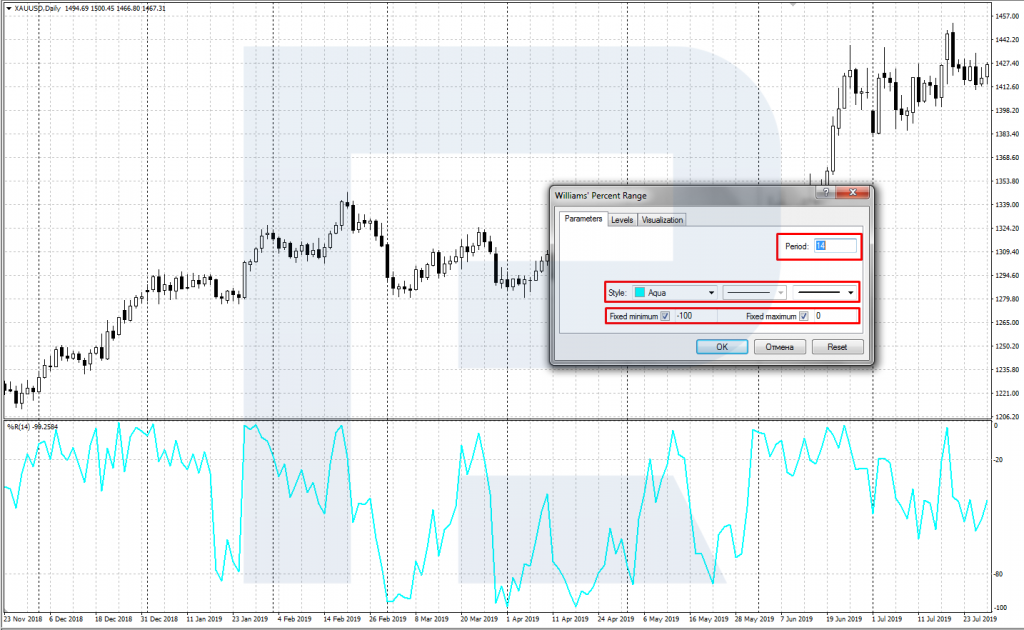
As you see in the picture, the indicator has a color scheme, two levels (-20 and -80, by default), and an only parameter by default set as 14 but customizable. Period 14 is considered universal for trading on practically all timeframes. However, on timeframes before M15 the indicator may give many false signals, that is why it better suits M15 and longer. Optimal timeframes would be M15, M30, and H1.
The indicator is multicurrency, which means it is suitable for all instruments: Forex and CFDs.
The formula, characteristics, and settings of Williams’ Percent Range
The Williams' Percent Range is drawn in a separate window under the price chart and consists of the main line %R showing the position of the price in relation to the previous period.
Formula of the main line:
%R = -1 * (Hm C) / (Hm Lm) * 100
Where:
- C is the closing price of the previous period
- Hm is the high of the last m periods
- Lm is the low of the last m periods
When installing the indicator, the following parameters should be set up:
- %R period is the calculation period for the main line. The default value, recommended by the author, is 14.
- Style: you can customize the color, the style, and the width of the line.
- Fix high and low: fixes the indicator window between 0% and -100%.
Also, the overbought and oversold areas are set up by default at the levels recommended by the author: -20% and -80%, respectively.
The Williams' Percent Range is most often used with a period of 14, set by default. However, you can always change it, assess the work of your indicator historically and choose an optimal period for your trading.
The Williams’ Percent Range and other indicators
The Williams' Percent Range pertains to the group of oscillators, which values are limited and which signal the chart deviate from the so-called normal values, i.e. signal its overbought or oversold state. The closest to the Williams %R in terms of the principle, formula, and the signals are the Stochastic Oscillator and the Relative Strength Index.
The Williams' Percent Range, like many other oscillators, shows good results in a flat (range) when there is no clear trend on the market. The drawback of the indicator is signals against the current trend in the case of a strong trend on the market.
In order to filter losing trades against the trend, it is recommended to use trend indicators together with the Williams %R, such as the MA (Moving Average). Then, the MA will act as a filter, the Williams' Percent Range signals will be used only along with the trend, where the MA is moving. If the MA is growing, only signals to buy are taken into consideration, and if the MA is decreasing, only signals to sell are used.
Trading the Williams’ Percent Range indicator
Let us have a look at the two main signals of the Williams' Percent Range.
Exit from the overbought and oversold areas
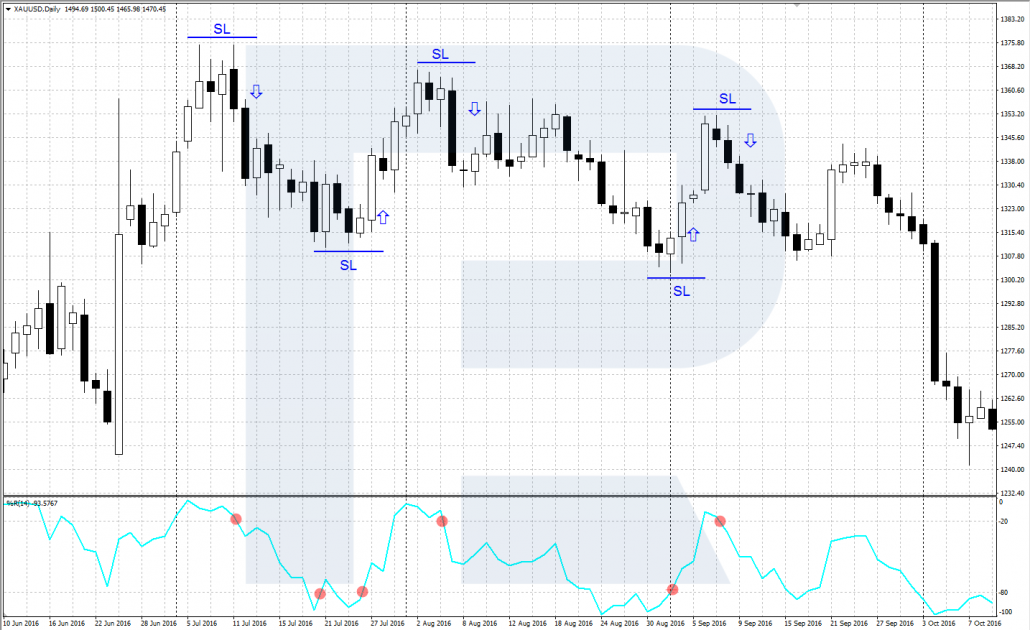
The main trading signal appears when the %R line escapes the overbought or oversold area. If the line escapes the oversold area (from -80% to -100%) and rises above -80%, buying is recommended, with a Stop Loss placed behind the local minimum. If the line escapes the overbought area (from 0% to -20%) and falls below -20%, selling is recommended, with a Stop Loss placed behind the local maximum.
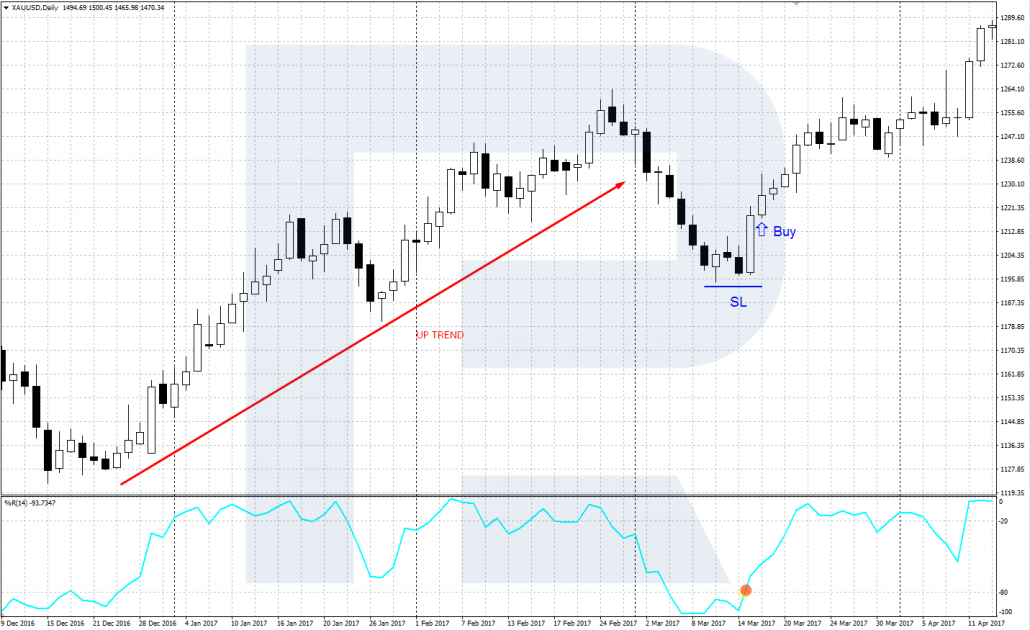
The strongest signal emerges when there is a trend on the market, and the price enters the overbought or oversold area as the result of a correction. i.e. in the case of an uptrend buying is recommended when the %R line descends to the oversold area, while in a downtrend one can sell when the %R line gets into the overbought area.
A divergence of the Williams’ Percent Range and the price chart
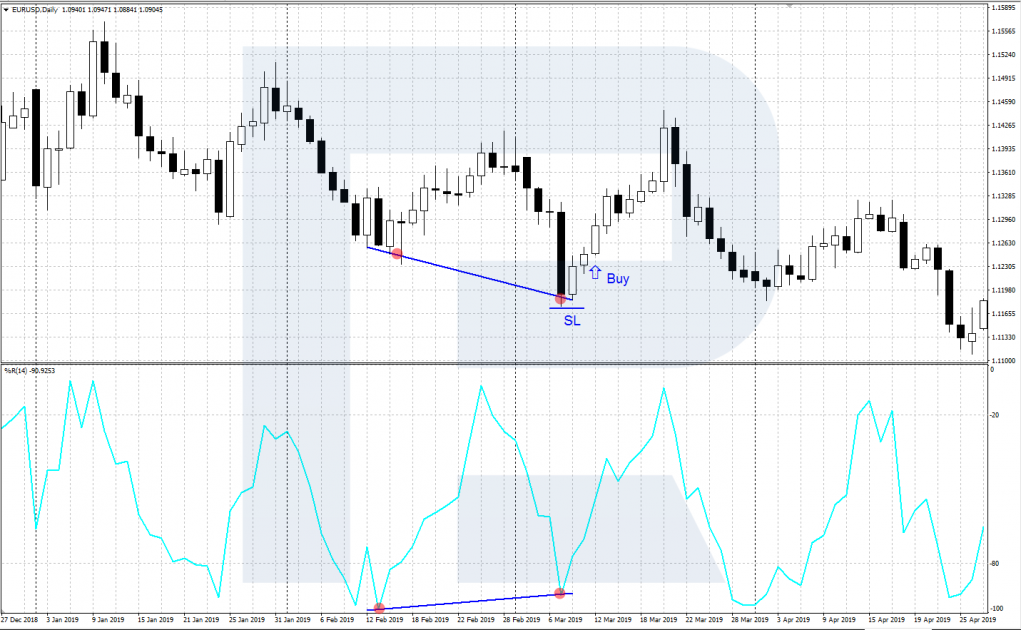
A divergence (from Latin divergere - to diverge, to fork) emerges when the price chart and the Williams %R diverge.
A buying, or bullish, divergence appears when the price chart demonstrates a new minimum, while the Williams' Percent Range shows a shallower minimum than before. This means the bears are weakening, and the falling of the price is almost up. After the second minimum is formed and the %R line starts going up, buying is recommended.
A selling, or bearish, divergence appears when the price chart demonstrates a new maximum, while the Williams %R shows a less high maximum than before. This means the bulls are weakening, and a reversal is possible at any moment. After the second maximum is formed and the %R line starts going down, selling is recommended.
Special conditions for trading by Williams’ Percent Range
- You can trade not only at the high/low of the trend but also at the beginning of a correction or the end of a pullback.
- You can add %R to almost any strategy, with or without indicators.
- After a flat, on highs/lows, the indicator gives much better signals.
- A key support/resistance level will enhance the efficacy of the indicator.
- To filter false signals, try using additional indicators, such as the Moving Averages.
- In some cases, the signal to close one position will be the signal to open an opposite one.
Summary
The Williams' Percent Range indicator gained popularity thanks to its creator Larry Williams that used to be a trading star. However, it is worth remembering that the indicator is not universal, it should be used together with other indicators or tech analysis. If your approach is comprehensive, the Williams' Percent Range may help you find good trades and extend your store.


