How to Catch a Trend Reversal? 5 Detection Strategies

10 minutes for reading
Experienced traders think it much more efficient to trade the trend than against it. Many of you must have heard such expressions as "The trend is your friend" — such sayings are plenty. At the same time, the desire to reverse the market may be provoked by merely the possibility to enter the market at the very beginning of the trend with minimal risks. So the desire to buy at the low and sell at the high is also rather understandable.
Again, one of the set phrases of tech analysis goes: "The current trend will be developing until it reverses". It pushes us to the idea that every trend will finish and reverse sooner or later. In this article, we will learn to detect such reversals.
What is a trend and where does it reverse?
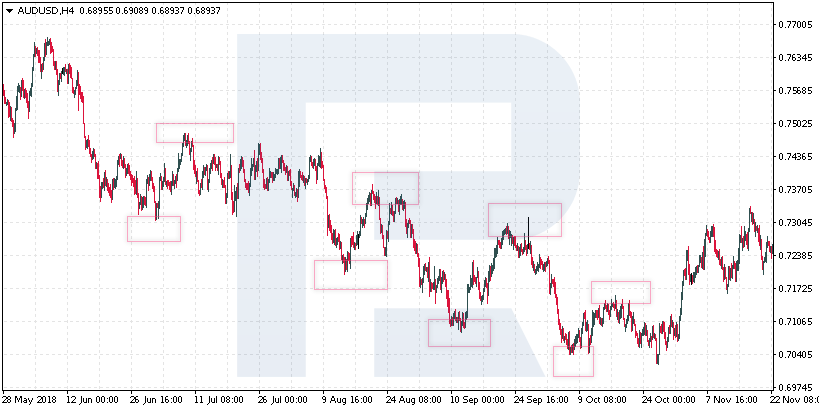
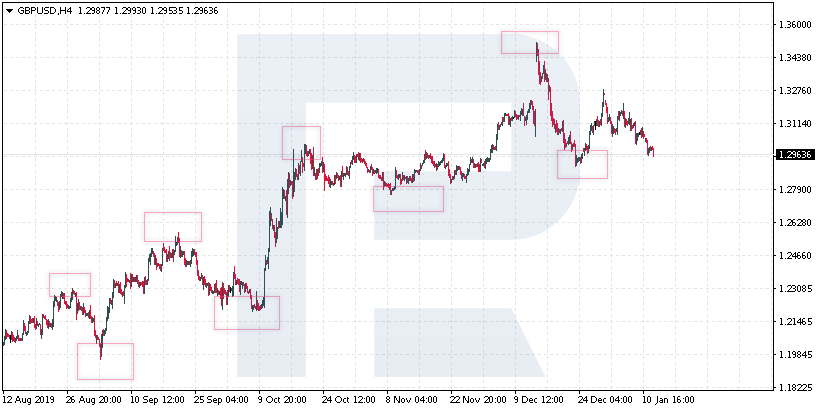
On financial markets, a trend is a directed price movement. In theory, when we see a movement with each next high being above the previous one, as well as each next low being above the previous one, we can speak about an uptrend. At such moments, traders try to buy as the current movement is likely to continue and thus change its direction.
Hence, if we expect a bullish trend to reverse, it is important for us that the next high became below the previous one, as well as the next minimum. At such a moment, we may suppose a trend reversal downwards. Here, we may start thinking about selling the instrument.
On the contrary, if in a price movement we see each next low and high below the previous one, we call this a downtrend. As for the reversal of such a trend, it is important that the next low was not renewed, and the price broke the high; this is a simple signal of a trend reversal.
As we can see, a reversal is built in any price behavior on the market. However, traders rarely look just at the price movements, most often they add various instruments to detect reversals better.
Reversal detection instruments
Experienced traders advise looking for trend reversal signals on daily charts. On the whole, the same can be done on smaller timeframes, but it should be remembered that in this case, the reversal will most likely be short-term, as the main trend is always better detected on D1.
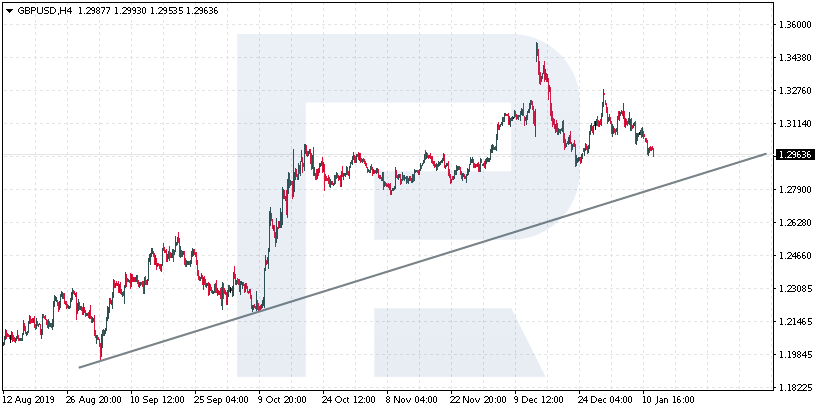
The simplest signal of a reversal is a breakout of the trendline. If this is an uptrend, we draw an ascending trendline through the lows and wait for it to be broken out. Most often, after the breakout, the price returns from the other side and tests the line, after which it goes down again.
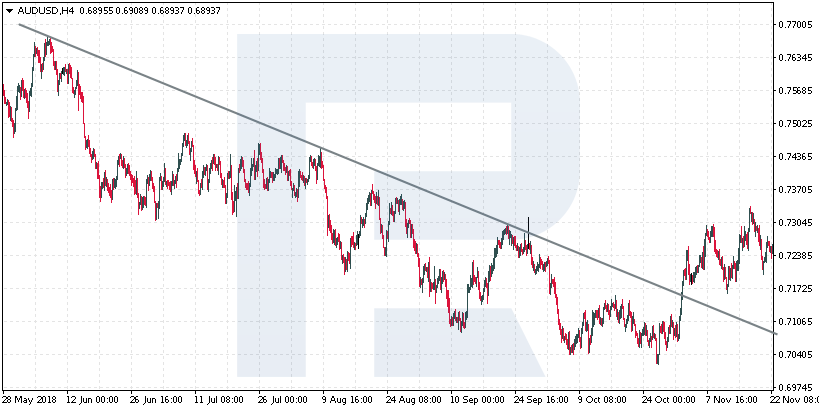
In a downtrend, the line is drawn through the highs, and the price must secure above such a line if we want to see a bullish trend.
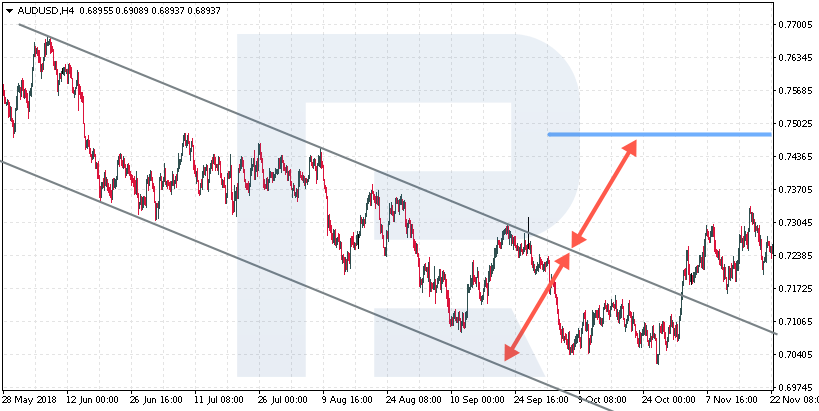
The next type of signal is a breakout of the border of the channel. Drawing channels is a bit more difficult than drawing trendlines, but the essence is the same: we wait for the price to escape the channel, at which moment the trend reversal forms. Many authors also draw the width of the channel to detect the potential for future price movements.
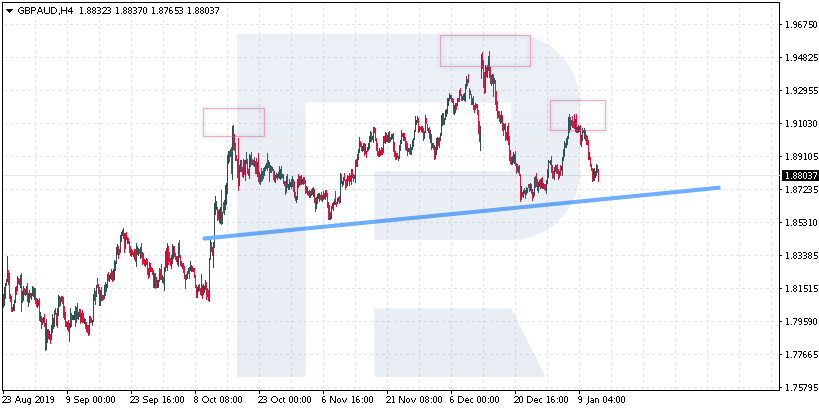
Graphic traders also like to detect reversals by trend reversal patterns, such as Head and Shoulders, Double Bottom or Diamond. These patterns are simple, but there are tricks in finding them on the chart and using them right, as only if applied well they can give good signals.
Do Moving Averages help?
Almost all trend indicators can be customized for a certain instrument and used to look for the end of trends. If we speak about the Moving Averages, which are one of the best trend indicators on the market, they can, of course, show us a trend reversal.
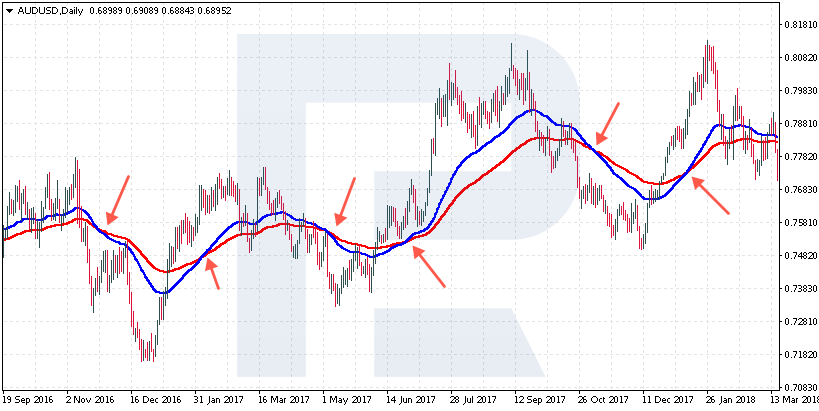
It is important to remember that the MAs are quite lagging. So, the signal for the end of the trend will be received when the next trend will be fully on. But many investors think this irrelevant, and if the new trend is strong, the part of the missed profit will be smaller than the potential profit from a good trend.
What is more, this indicator will signal the trend, so we will be able to hold the positions and add new ones for as long as ever possible. Also, there is an opportunity to get a confirmation in the form of the return of the prices to the MAs after the beginning of a new trend. Such a return will allow entering in the direction of the trend with less risk.
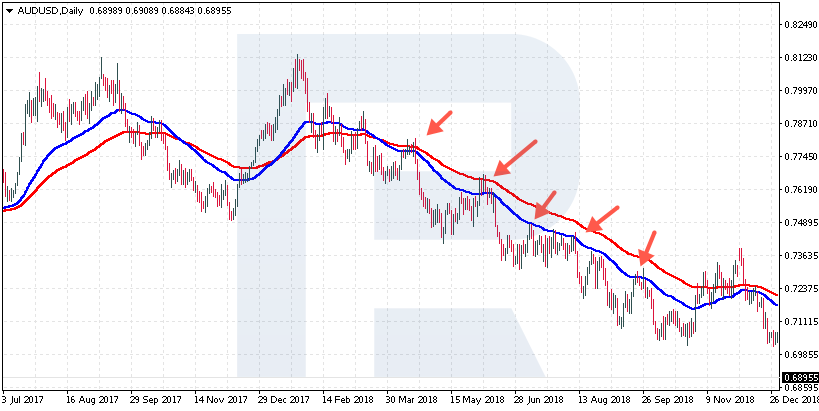
However, the MAs will not help to determine the reversal at an early stage. On the other hand, they may show that the current trend is slowing down and losing strength at the moment when after a wide divergence the lines start to near up again. We can easily notice this and start looking for confirmation of the trend reversal.
How to catch a reversal with the help of patterns?
This is, perhaps, one of the best ways to enter the market at the end of the trend with minimal risks. If you as a trader prefer analyzing the chart and watch the price, this way will suit you perfectly. Any of the patterns here can give a good entry point to the market when it is just forming; the risk will be decreased to entering as close as possible to the upper or the lower border of the pattern.
If we are speaking about the Double Top pattern, it is important here to enter selling at the moment of the second test of the resistance level forming, and the Stop Loss should be put above this area. If the price is moving in our direction, we will be able to add our position at the breakout of the support level, as advised in classic tech analysis. And when the price keeps growing, we exit the market with minimal losses.
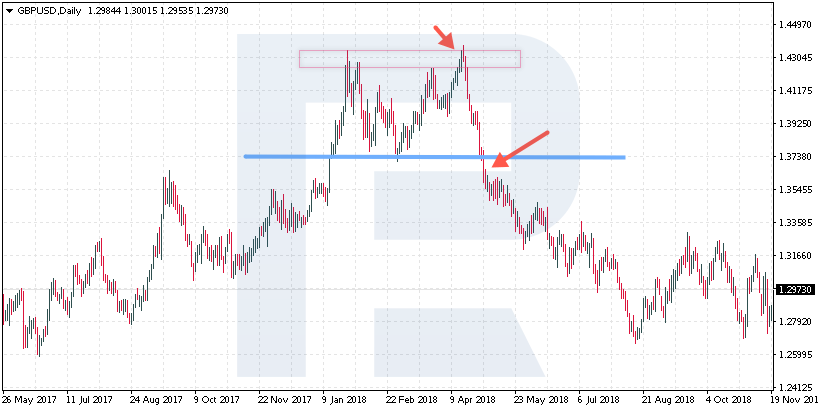
Here, we need to master the instruments and understand when to exit the market if the price is moving against us because in this case, the trend continues and the desire to stay on the market and wait may entail serious losses.
At the same time, with patterns, we get an opportunity to enter the market at the early stage of the trend ending. This is one of the main advantages of graphic analysis. The nature of patterns and the trend on the market are closely connected, and we react to price fluctuations in particular, not to their results, as with indicators.
A divergence - a good signal of a trend reversal
Alexander Elder singled out the divergence as a signal on the MACD, as one of the strongest ways to reverse a trend in the graphic analysis. Indeed, we can see the strength of this signal on daily charts where they can provoke serious corrections. Here, it is also quite easy to enter the market: when the signal line escapes the histogram area, we sell, provided that the signal forms above zero.
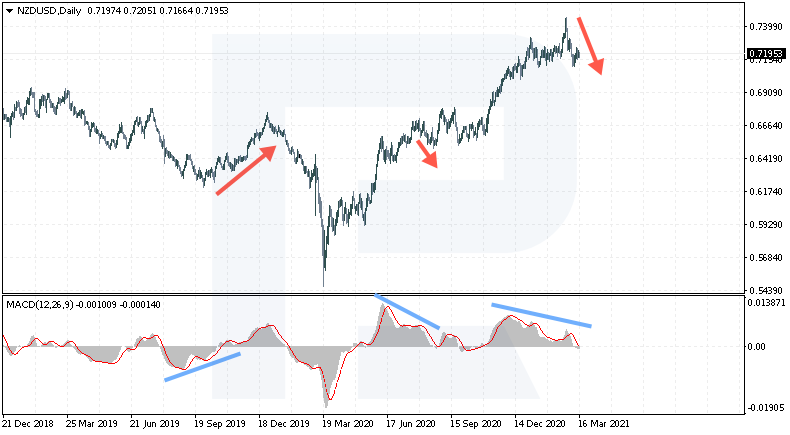
If the trend is descending, and the signal forms below zero, the exit of the signal line from the histogram area will signal to buy. However, there are nuances: not always do we know where the formation of such a signal may end. Sometimes Double Divergences happen when the price moves down and down while the signal remains in force. In such cases, we have to hold the position but the risks grow significantly.
Summary
To detect trend reversals, we can use simple instruments of tech analysis, such as the trendline, channels, and reversal patterns - or we can add indicators but get lagging results. For a better outcome, you can combine several of the discussed means. For example, when a divergence forms on the MACD, the trader waits for the trendline to be broken as a confirmation and only then enters counter the current trend. This way we get two signals of the current trend ending, which makes our position much stronger.
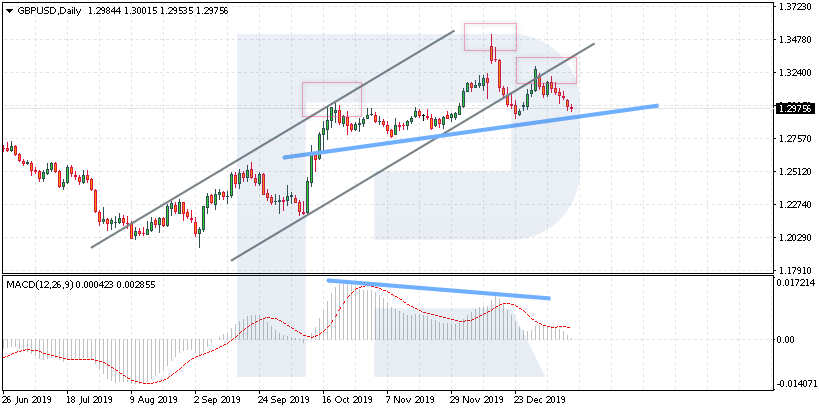
It should be remembered that looking for trend reversals is not always efficient. Many experienced investors still advise trading the trend only to avoid serious losses in the case of a mistake. However, if you can detect such moments, why not use the signal and enter the market with minimal risk.


