How to Trade Price Action Patterns: Describing a Trading Strategy

7 minutes for reading
In this article, we will discuss the basics of a popular method of trading called Price Action. As long as it is focused on the price movement, uses indicators scarcely, features simple and clear rules, it remains an efficient instrument in the hands of an experienced trader.
Price Action trading strategy
The trading strategy of Price Action is based on detecting certain schemes in the price behavior that are later used in trading. In essence, Price Action is further development of market tech analysis as it also uses levels and support/resistance lines and price patterns.
The main rule of Price Action strategy (and tech analysis) goes: "the price takes everything into account". It means that price movements are based on all events in the world: economic, political events, force majeure. All news influence the price at once, so we analyze quotation charts directly, without accounting for fundamental data.
There are several original approaches to trading based on Price Action patterns. Influential researchers and popularizers of Price Action are two traders known as James16 and Jarroo. Regardless of certain differences in the approaches, they are all based on using price patterns (or candlestick patterns) together with other elements of Price Action.
Indicators in Price Action are hardly used, only as an additional filter to trading patterns. For example, the Moving Average can be used as a dynamic support/resistance level, and Fibo lines will show the places where the price formed a reversal in the direction of the current trend after the end of a correction.
Demand and supply zones
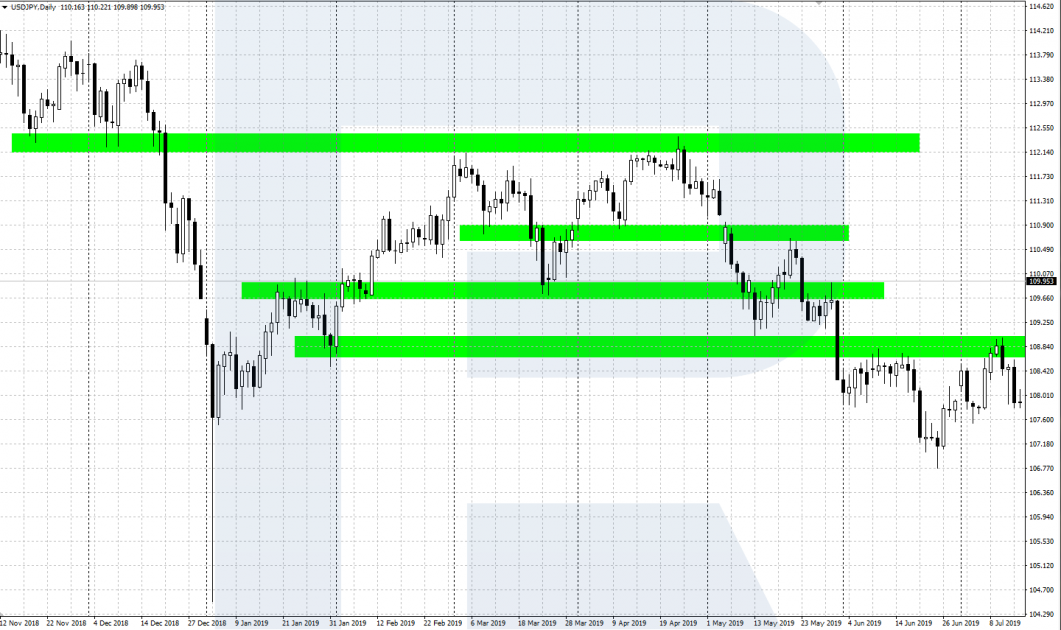
In tech analysis, the most important analysis factors are support and resistance levels. In Price Action, they are called zones (levels) of demand and supply. Demand and supply regulate price movements. Demand and supply zones are limited price ranges in which the quotations changed their direction or started a strong impulse movement.
For traders, the demand and supply zones play the most important part. Almost always, they give the best entry points with an advantageous risk to the potential profit rate. The longer the period of the chart, the more important the demand and supply zones on it. Crucial periods are daily, weekly, and monthly ones. In Price Action, a lot of attention is paid to the trading patterns formed in the demand and supply zones.
Price Action trading patterns
A trading signal in Price Action is the formation of a certain price pattern on the chart. History tends to repeat itself, so the patterns that executed well historically can work well in the future. Below, we will discuss several main patterns in Price Action:
Pin Bar
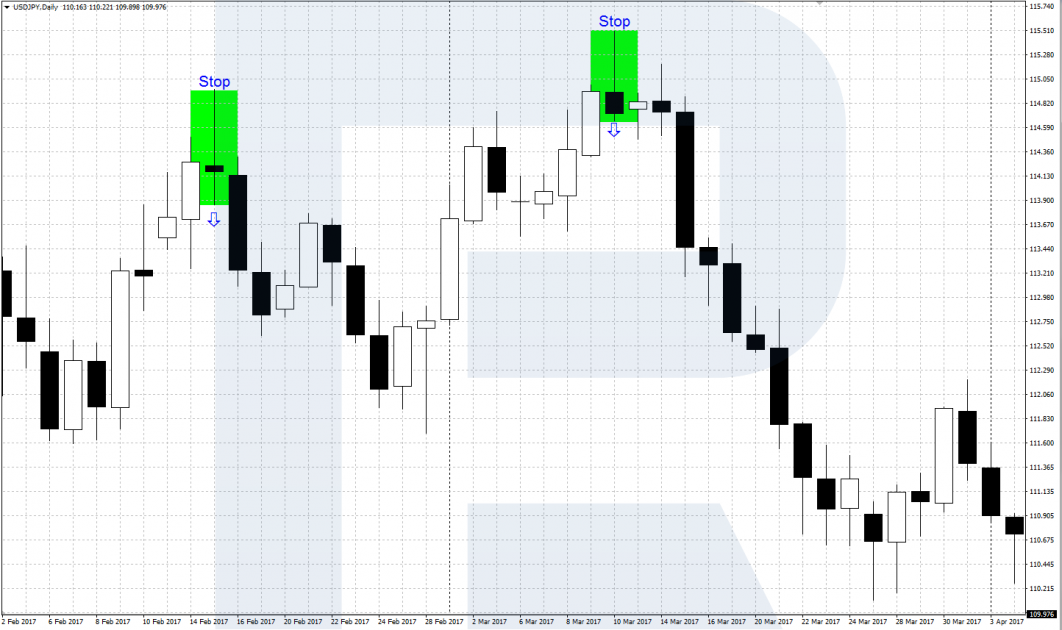
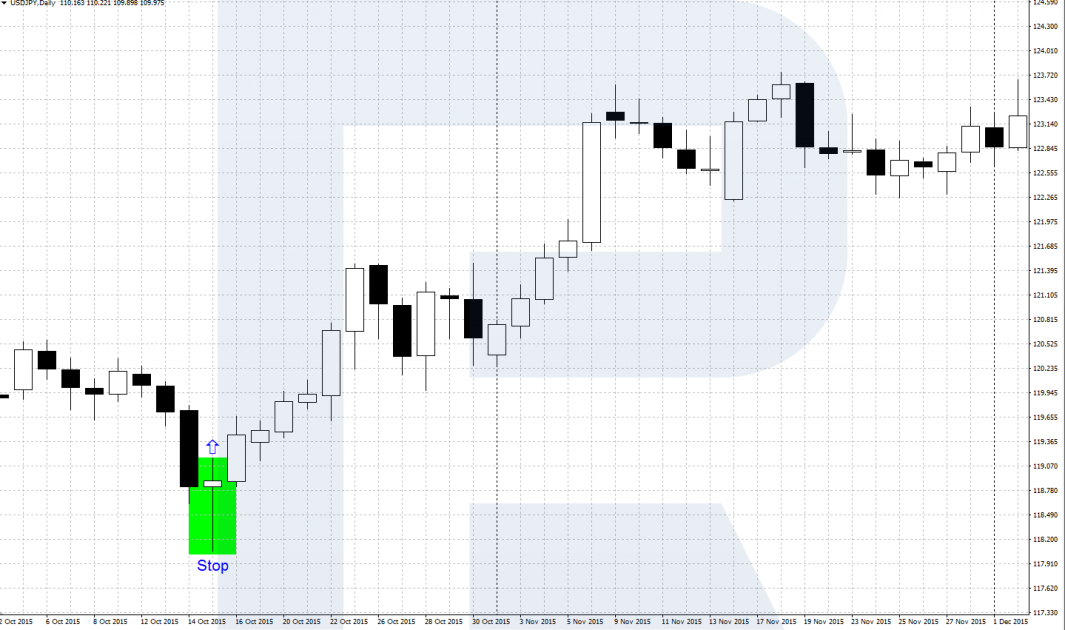
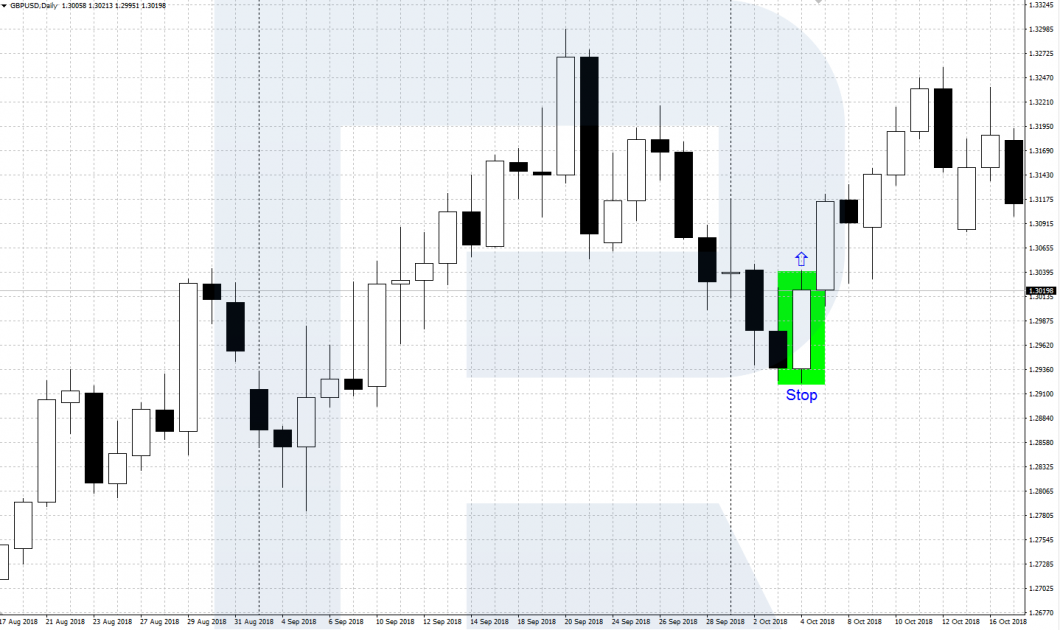
Pin Bar is the most famous reversal pattern in Price Action. It looks like a candlestick with a very long "tail" and a very small body, situated in the borders of the previous candlestick. The longer the shadow, the stronger is considered the pattern.
Bearish Pin Bar
Forms on the market highs, has a long shadow upwards and a small body in the borders of the previous candlestick. When the price moves below the low of the Pin Bar we can sell with the SL above the high.
Bullish Pin Bar
Forms on the market lows, has a long shadow downwards and a small body in the borders of the previous candlestick. When the price moves above the high of the Pin Bar we can buy with the SL below the low.
Double bar: DBLHC and DBHLC
The pattern consists of two candlesticks with the same highs and lows.
DBLHC (bullish pattern)
Consists of two or more candlesticks with the same low (maximal difference 3 points), the last candlestick closes above the high of the previous one. The entry point to buy is above the closing of the last candlestick of the pattern, the SL is below the low.
DBHLC (bearish pattern)
Consists of two or more candlesticks with the same high (maximal difference 3 points), the last candlestick closes below the low of the previous one. The entry point to sell is below the low of the last candlestick of the pattern, the SL is above the high.
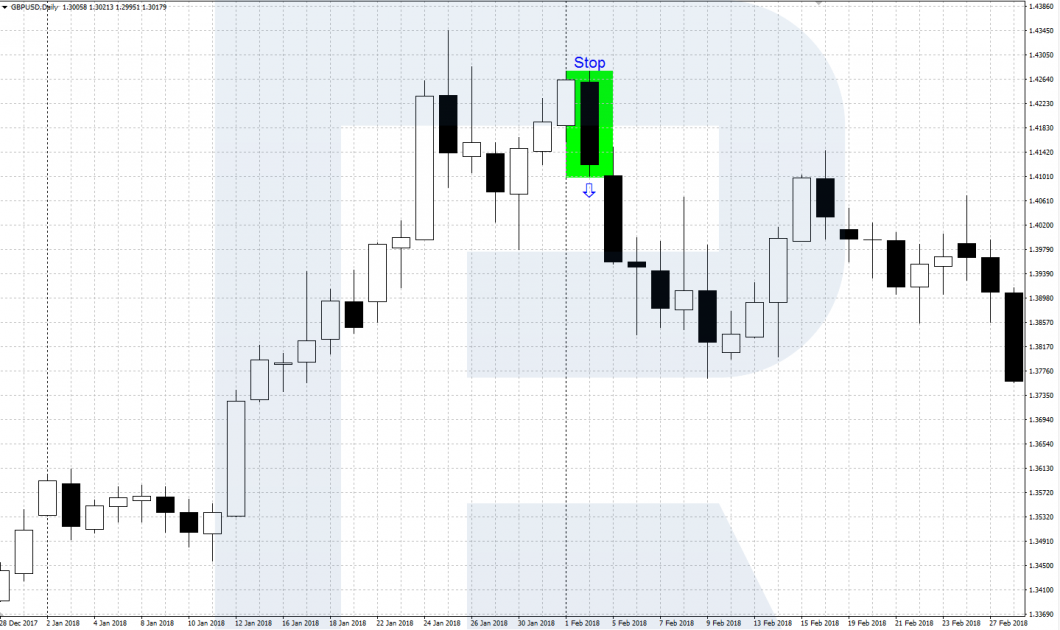
Rails
The pattern consists of two subsequent candlesticks in different directions with large and roughly equal bodies.
Bullish pattern
The first candlestick is bearish, the second one is bullish. The entry to buy opens above the high of the pattern, the SL is behind the low.
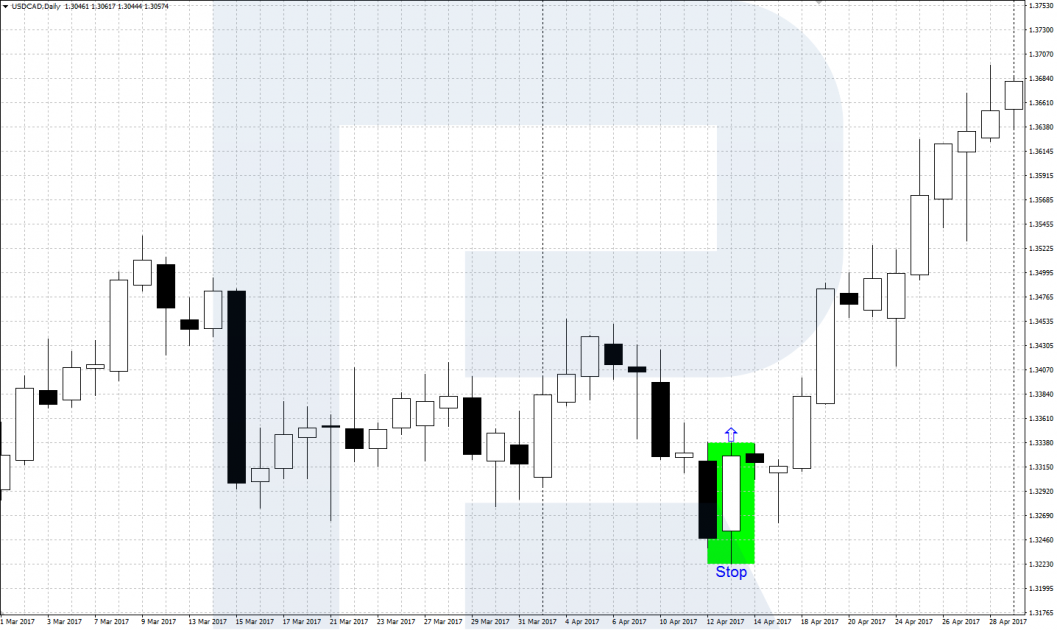
Bearish pattern
The first candlestick is bullish, the second is bearish. Sell is entered if the price is below the minimum of both candlesticks, the SL is above the high.
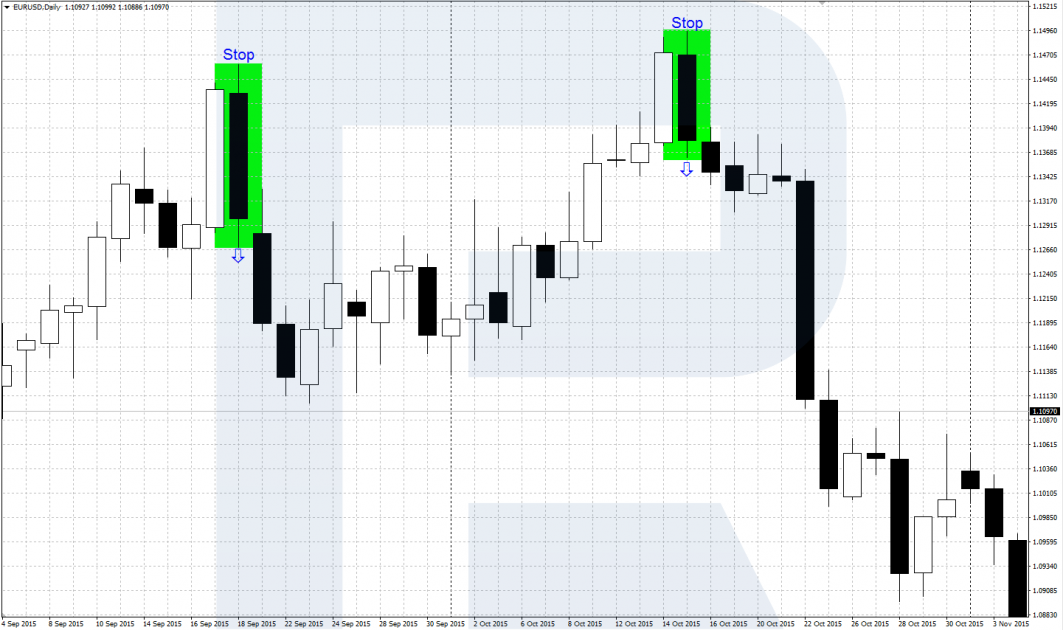
OVB
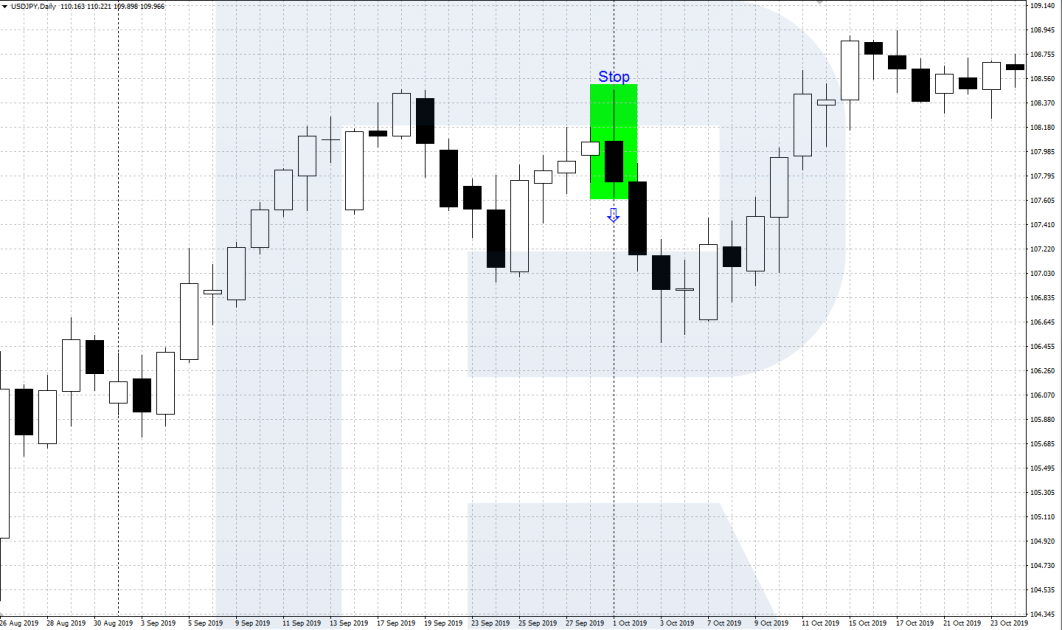
The pattern consists of two candlesticks (a bullish and a bearish one) with the last one covering the first one fully.
BUOVB (bullish pattern)
The second, bullish, candlestick of the pattern fully covers the first, bearish, one. The closing price of the bullish candlestick is above the high of the bearish one. Buying happens slightly above the high of the bullish candlestick, the SL is below the low.
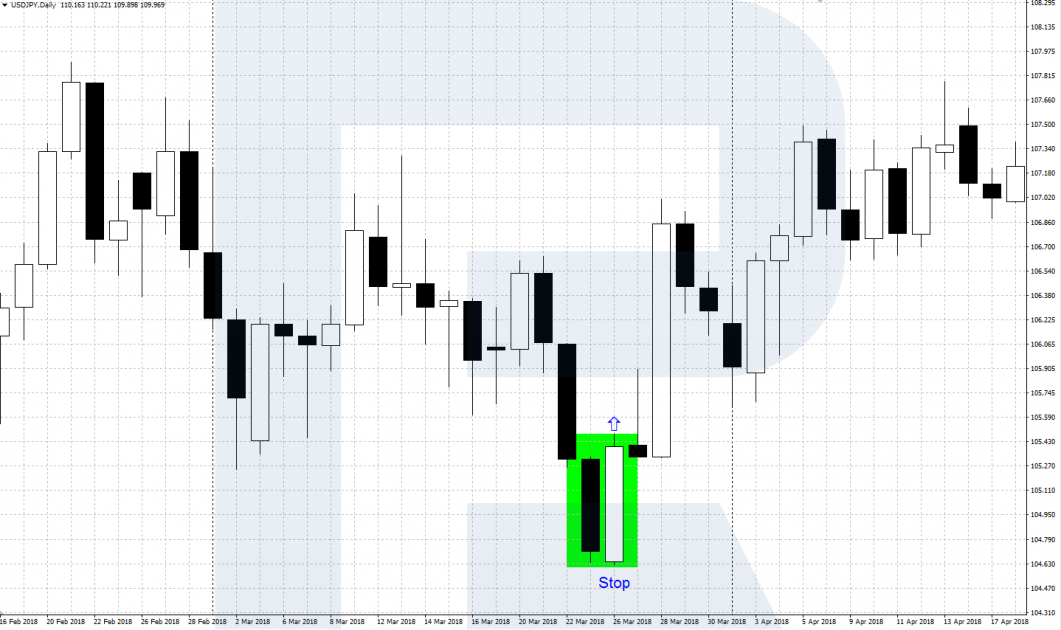
BEOVB (bearish pattern)
The second, bearish, candlestick of the pattern fully covers the first, bullish, one. The closing price of the bearish candlestick is below the low of the bullish one. Selling happens slightly below the low of the bearish candlestick, the SL is above the high.
IB
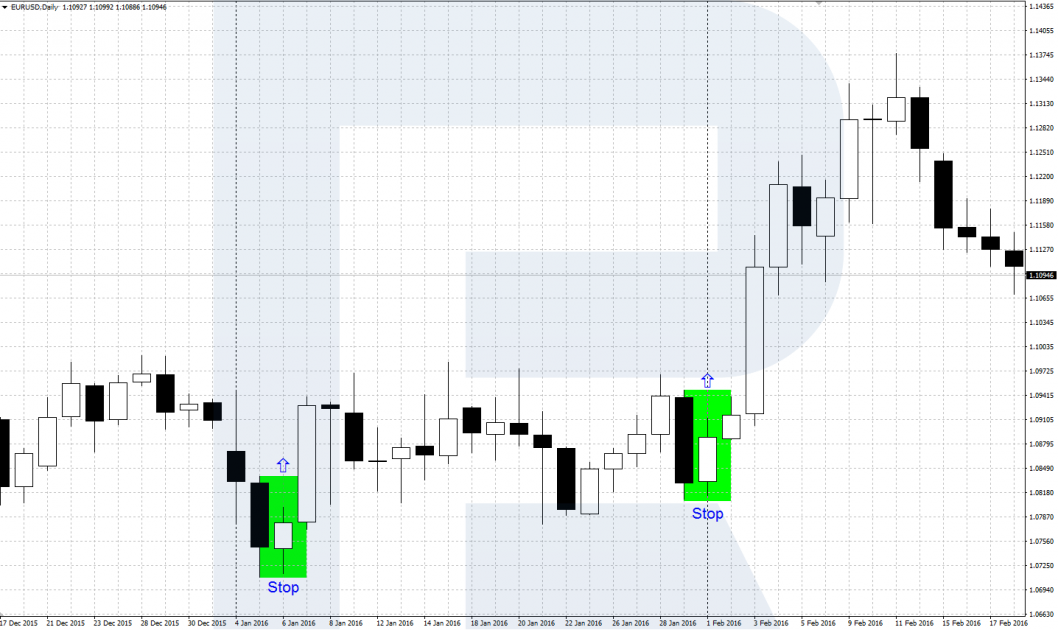
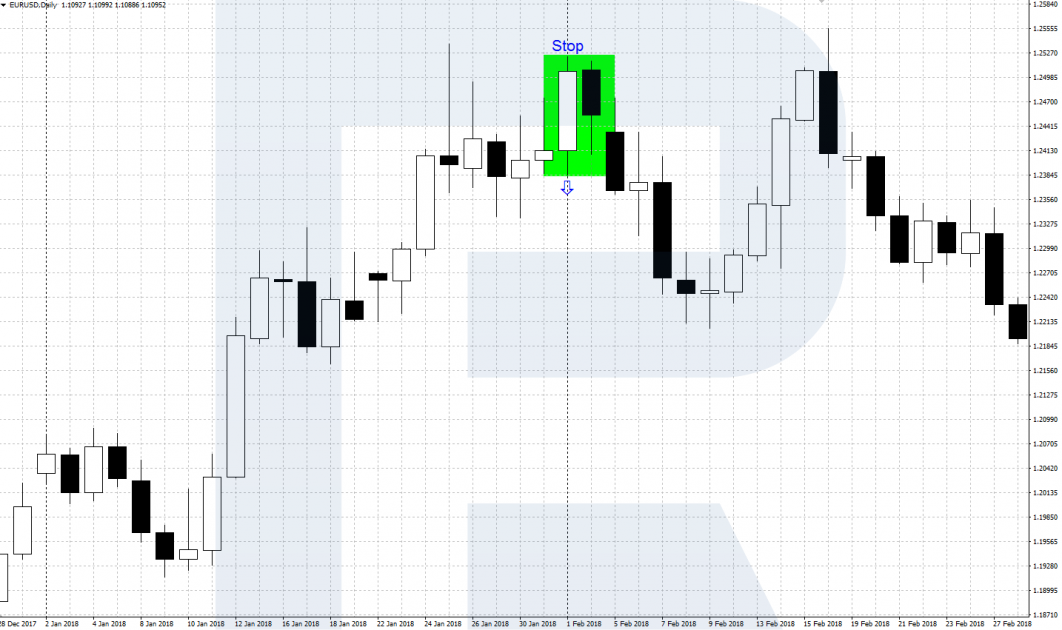
The pattern consists of two or more candlesticks, where the range of the last (or a couple last) candlestick(s) is inside the range of the first one. The first candlestick is defining.
Bullish inside bar
It consists of a large bearish defining candlestick and one or several candlestick(s) inside its range. Buying happens above the high of the first bearish candlestick of the pattern, the SL is behind the low.
Bearish inside bar
It consists of a large bullish defining candlestick and one or several candlestick(s) inside its range. Selling happens below the low of the large bullish candlestick of the pattern, the SL is behind the high.
Price Action Indicators
To help you find trading patterns, several computer indicators have been created in Price Action. These indicators help you learn to define important patterns on the price chart as well as save the trader's time, looking for them automatically.
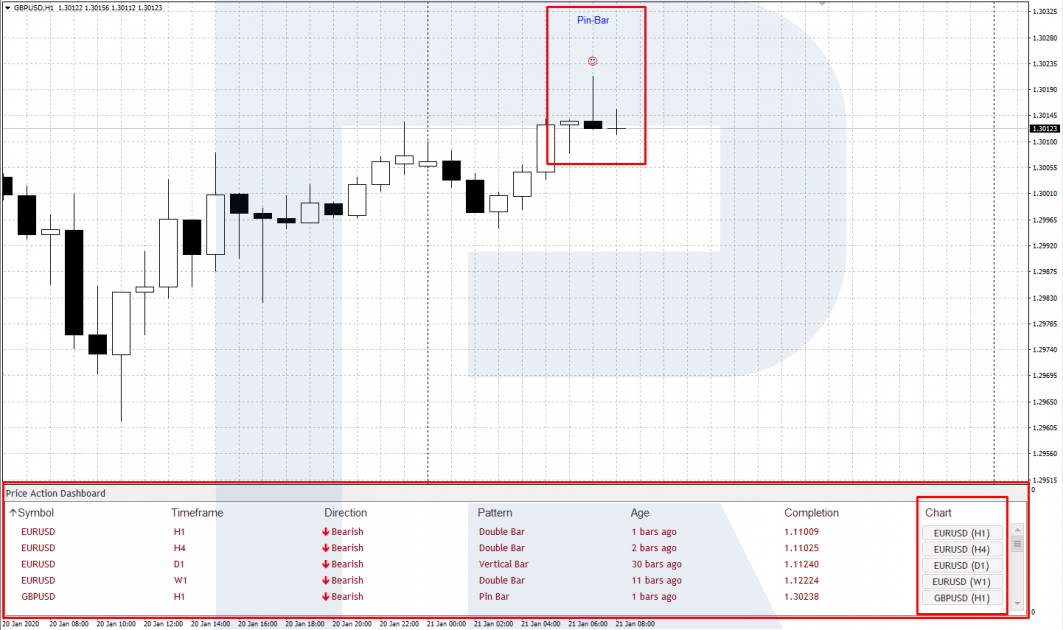
As an example, let us take the Price Action Dashboard for MT4. This indicator helps find three strong patterns on the chart: Pin Bar, Vertical Bar (BUOVB and BEOVB), and Double Bar (DBLHC and DBHLC).
The indicator is available on the Net: to start, you download it and install it in MetaTrader 4. For this, in the MT4 main menu find File, then Open data catalog/MQL4/Indicators and copy the file with the indicator to the folder. Then restart the terminal. Then install the indicator to the price chart via the main menu of the terminal: Insert/Indicators/User/Price Action Dashboard.
The indicator is by default set up for three currency pairs - EUR/USD, GBP/USD, USD/JPY. Other instruments can be added manually via Symbols: other currency pairs, gold, CFDs, etc. Also, timeframes are customizable: from M1 to MN, by default M1-M15 and MN are off.
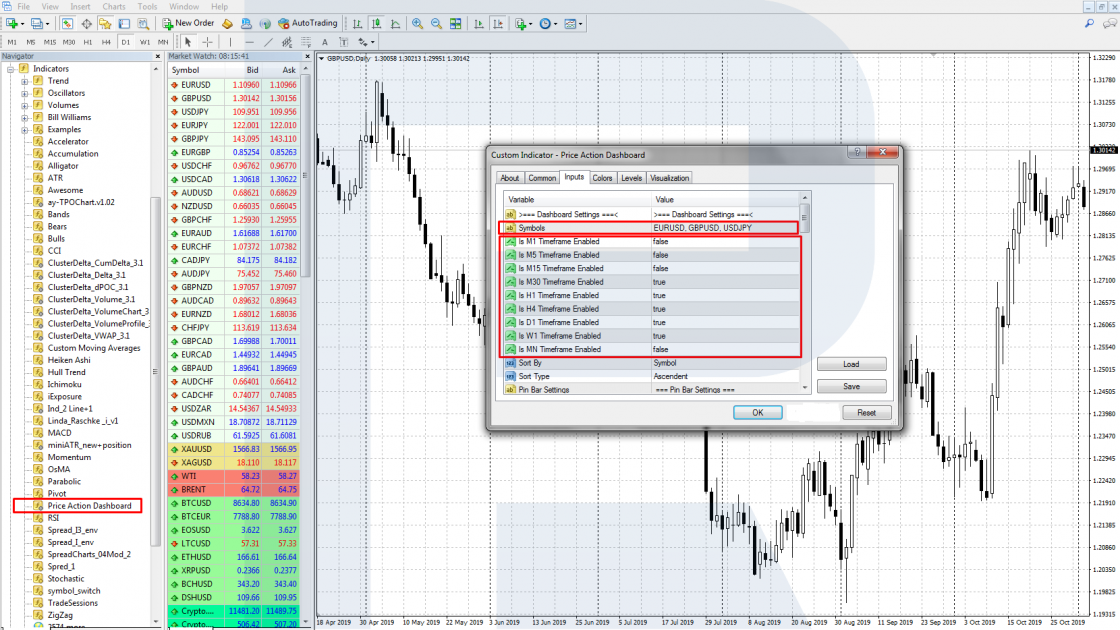
All information about the patterns that the indicator has found is reflected on the chart as a smile with the name of the pattern as well as on a special information board under the chart. Clicking the necessary instrument (the timeframe is specified in brackets) on the Chart field, you can access the chart with the Price Action pattern found.
Summary
Price Action is a popular and efficient method of trading, using certain trading patterns. It should also be realized that Price Action is not just trading patterns but an elaborate set of elements: the demand and supply zones, neat levels, Fibo levels, trading patterns.
In this article, we cannot discuss all aspects of trading Price Action that are necessary for success. I recommend professional literature, such as the book by A. Bashaev "Price Action Trading Technique".


