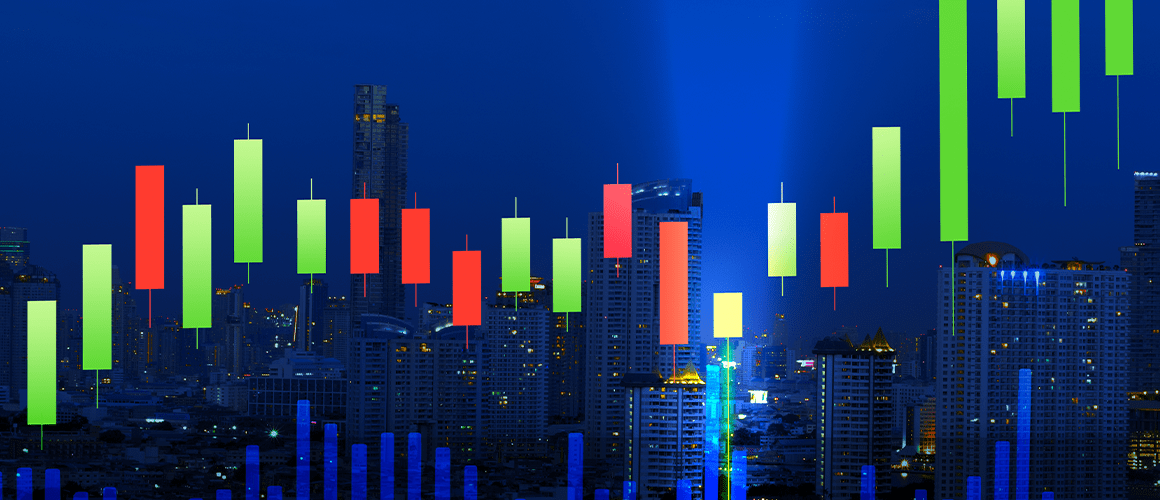
Trading Strategies That Were a Revolution: Trading Chaos-2 by Bill Williams
21 minutes for reading
Welcome back to our blog!
Hello, our dear blog readers! I hope you’ve read the first part about Bill Williams and his Trading Chaos and are about to read the first book from A to Z. If necessary, read the book for the second and third timesб it surely will prove useful. Most likely, you may even like to read again and find out some new nuances and aspects and relate them to each other.
Right now, I’ll start talking about the second edition of Trading Chaos by Bill Williams. In this book, the bestselling author introduced a new term, TradeVesting, a combination of trading and investing. The first part is devoted to a trader’s psychology, their interaction with the market, the right way of thinking; it adds some new recommendations and revises the old ones. It also describes a consistent trading system based on the Trading Chaos Theory, which may be rightfully considered as one of the best.
“Chaos is where great dreams begin. Before a great vision can become a reality there may be difficult.”
“Before a person begins a great endeavor, they may encounter chaos.”
Hexagram 3, “I Ching” ("Book of Changes")
“As a new plant breaks the ground with great difficulty, foreshadowing the huge tree, so must we sometime push against difficulty in bringing forth our dreams.”
From the very first lines, Williams reminds readers and thereby emphasizing his thought, that our thinking and interpretation of the market are backbones of our own trading. Once again, he says that markets are not complicated, mysterious, or incomprehensible. And money is also real, just like our thoughts about them. The value of money, as well as trading success, lies in ourselves. In other words, the author continues reminding us of the necessity to improve and perfect ourselves in all aspects of life.
Williams calls fundamental truths that will help traders snap a losing streak and become a successful trader “Five Sacred-Cow Terminators”:
- Don’t listen to the popular experts.
- There is no such thing as a bullish/bearish consensus.
- There is no such thing as oversold/overbought.
- Most money management suggestions are ineffective.
- Common formulas for profitable trading do not work
All these terminators will make some people be disappointed, while others – awake from artificial dream, think for themselves, and make their own decisions. By so doing, Williams tells us “Remember, there is no reality, there is only perception.” This thesis became a foundation of the entire Chaos Theory, after all, most people on the market continue to trade their opinion, although they should trade goods.


Chaos Theory – a new paradigm for trading
It’s well known that the heart has to beat largely regular or you die. But the brain has to be largely irregular; if not, you have epilepsy. This shows that irregularity, chaos, leads to complex systems. It’s not all disorder. On the contrary, I would say chaos is what makes life and intelligence possible. The brain has been selected to become so unstable that the smallest effect can lead to the formation of order._
Ilya Prigogine
A paradigm, through which we look at the market, defines what we do and, consequently, achieve. Chaos Theory offers a new paradigm for seeing markets and ourselves.
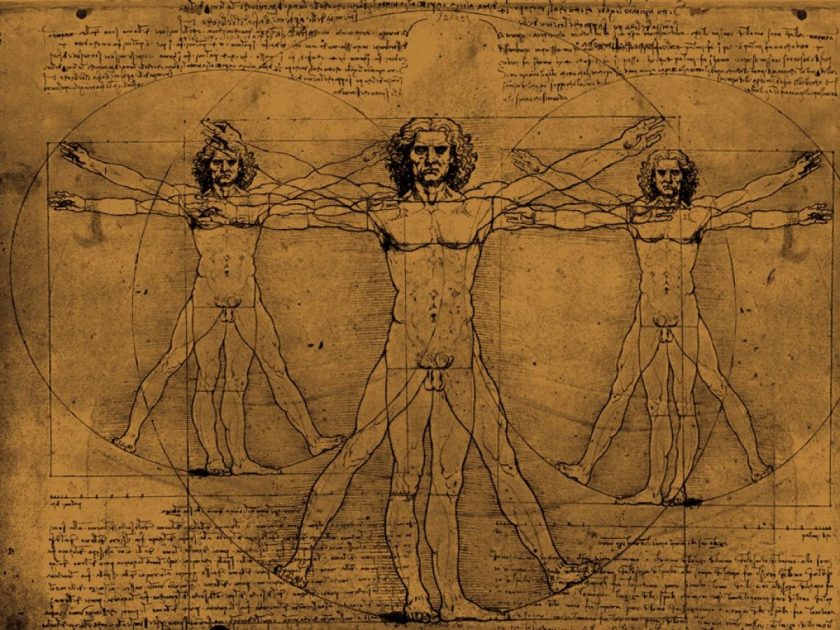
Chaos doesn’t imply a random nature, it’s just a higher and different degree of order. Because both nature and the human brain are chaotic, the markets, as a part of nature and a reflection of human nature, are chaotic as well.
Nature and the world appeared from nonlinear sources. Things created by people are a product of the left hemisphere, that’s why they are linear. Creating trading systems in the same way, a trader can’t successfully describe the market and make a profit from it.
Fractal geometry and markets
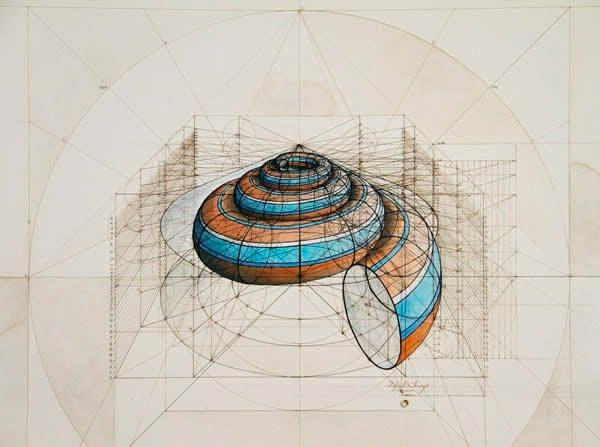
Fractal geometry is one of the tools of the science dealing with chaos. This means that the market is generated by turbulent collective activity and is a nonlinear phenomenon of a fractal structure. Any trader with a bit of experience has learned that the markets are not a simple, mechanical result of supply and demand.
Fractals can be seen on charts due to accretion and iteration. The simplest model of iteration is the summation sequence known as Fibonacci numbers. The sequence starts with 0 and 1. Then, by adding together the two immediately preceding numbers, the sequence becomes the following:
0, 1, 1, 2, 3, 5, 8, 13, 21, 34, 55, 89, 134, and continues to infinity.
The curious property of this iteration process is that each number in the sequence is exactly .618 of the next number.
What we see in the market depends just as much on our current paradigm. If we are coming from a linear perspective, we will never see the real market and will be at a disadvantage when it comes to trading and making profits. The more irregular and choppier a market is, the larger will be its Fractal number
Trader’s underlying structure and how it affects their success
Bill Williams believed that fundamentals and technical analysis do not accurately reflect the market’s behavior. If the markets were linear, there would be fewer losers, particularly in view of the high intelligence of the average trader. The science of chaos provides three primary principles for study of the markets:
- Energy always follows the path of least resistance
- The path of least resistance is determined by the always underlying and usually unseen structure
- The always underlying and usually unseen structure can be discovered and can be altered
What is the structure? Any structure consists of four elements:
- components
- plan
- power source
- purpose
All structures have a tendency to change from one state to another. In each case, the underlying structure determines the tendency toward movement. Structure determines behavior. Structure determines the way anything behaves — a bullet, a hurricane, a cab driver, a spouse, a market. The structures that have the most influence on your trading results are composed of desires, beliefs, assumptions, aspirations, and, most of all, your understanding of the underlying structure of the market and yourself.
Type one structure
A Type One structure produces an action-reaction, back-and-forth, figure eight type of behavior: one type of desired behavior leads into an opposite undesired behavior. A simple example is the pendulum.
If your underlying structure is one of oscillation, no solution will help because psychological solutions do not address the underlying structure that causes behavior.
Type two structure
A Type Two structure is located in the creative part of the brain. If Type One structure attempts to solve problems (quit losing), then Type Two structure is geared for action that brings something new into being. Rather than solving problems, it creates results.
Problem-solving does not enable you to create what you want (profits); often, it perpetuates exactly what you do not want (losses). You do not need to transform your trading, you need to transcend it.
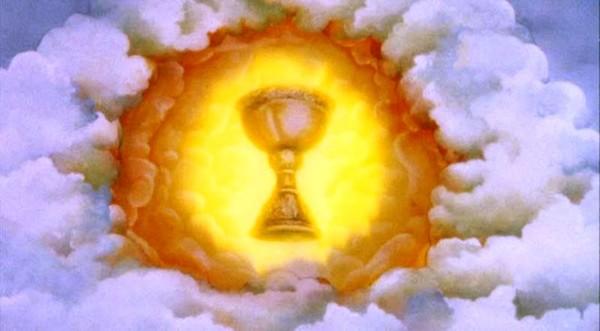
Grail and gearing up for trading
Successful trading has nothing to do with buying a new powerful computer with ten monitors, new indicators, digests, or books. They won’t make you a better trader. You should change. Trading is an inside job.
When you trade the markets, there is nothing to hide behind. At the end of the day, you either have more money, the same, or less. If you lose, there is simply no one to blame. The converse of this statement is that if you win, you do not have to say “thank you” to anyone. What you really need to see through is your choice of belief systems.
You can choose. As a matter of fact, the most important choice in the whole world is “either to choose to choose or not to choose.” If you choose to follow a mechanical system, you have not really chosen to trade the market. Your true nature is all you need. The Holy Grail of trading is knowing what the market wants. It will give you an edge and put you on the same side as the market.
What happens when you do not want what the market wants?
- You are often nervous and anxious because the market may not cooperate with your plans
- You are usually scheming in some way to outsmart the market
- You are either in a battle or recovering from one (usually a loss)
- You are easily angered when interrupted or distracted by something
- You are driven to trade more, risk more, to go temporarily catatonic
- You are jealous of other traders who are making profits
- You feel that what you have is what you are and not making profits means you are nothing
How is life when you want what the market wants?
- You are never disappointed with what happens
- You are in the right place at the right time
- You are quietly confident no matter what the circumstances
- You are out of reach of anger and anxiety
- You are awake and sensitive to the market movements
- You are free of that feeling that you may have missed out
- You are in command of events
- You are mentally quiet
- You are eternally grateful
In trading, you must be in the right place at the right time and the same thing is true with your mind. You must be coming from the right place at the right time. Mind location is much more important than trade location. Remember that trading should be fun, as if you grow lighter in spirit. That lightness, then, lets you see the obvious about the market.
What category do you think you fall into?
In the markets, we have individuals who feel more comfortable in the role of Columbus (the traders), while others feel more comfortable in the role of the crewmember (the investors). There are also the individuals who feel more comfortable assuming the role of the landlubbers (the savers).
If you are an independent thinker and enjoy making decisions, even if you are acting against the majority opinion, you are most likely a person who feels comfortable in the Columbus role. Those who fall into the crew member category are at a slight disadvantage because their success or failure depends on the success or failure of their leader. It is not uncommon to hear complaints from crew members about people, circumstances, or things that happen to them as if they have no control over those circumstances/
Landlubbers feel more secure because they do not worry about taking risks. They tend to be content or willing to put up with their level of discontent. Landlubbers tend to be procrastinators. Their thinking is that it is safer to put off making a decision than being held responsible for making one.
Super-Natural Trade/Vesting
The market is a creature of chaos— a far from equilibrium soup simmering on the uneven flame of trader psychology. Therefore, to consistently win we must: go with the flow, ride the tide, and bend with the trend.
The market is a three-dimensional happening: Time + Price + Your Psychology.
The most common trading behavior today is found in the person who can win, win, and win and then lose it all on some stupid decision. We think when we lose that we need other techniques, more information, a new indicator, or an entirely new approach. What we really need is a new mind.
To look at our life and the results we get, we must also look at reality. Keeping this generic, we define reality as what is. In fact, every time you place an order you do so because you have a fantasy that the market is going to move one way or the other.
Short resume
No one is 100% sure where the market will go. No one can control the markets. We, as traders, are at the mercy of the market movements, but we can control our mental reactions to whatever happens if we just learn to understand how our thought process works.
When the market is confusing or bringing up pictures of disaster, we have three choices. We can go crazy, catatonic, or conscious. In other words, we can relate to our mind rather than react to our thoughts. It is really important to realize that our wild and crazy mind, filled with the same type of untamed, tangled thoughts that run through it. First of all, you should work on yourself, but not the market.
The Stairway To Profits
Just like in his first book, Bill Williams insists on the idea that there is a universal five-step progression from first interest or novice to becoming an expert in any field of endeavor.
The function of the novice level is to enable you to trade in the market and not lose money while you gain experience.
The advanced beginner has become a quality producer of profits.
The competent trader is more like a craftsman who uses tools in their everyday work that leads to planned results. In other words, the competent trader increases their total ROI for every deal by varying both instruments and volumes.
The proficient trader trades at the same pace the market lives. On this stage, a trader creates both mentally and physically their underlying structure based on the market’s structure.
For the expert trader at Level Five, trading is a low-stress way of living. You feel as though you are floating down a river that is providing you with any desire you name. Your nice fantasy has become completely achievable by following the Profitunity approach.


The Mighty Alligator
In this early part of the twenty-first century, we have a choice to either be a part of the last generation of traders and investors using linear (ineffective) techniques, or the first generation using effective nonlinear (chaotic) techniques
The Alligator serves as a compass to keep us trading in the appropriate direction regardless of which way the immediate price is moving.
Alligator’s tasks
- Provide an integrated approach to monitoring the market’s momentum on three different time frames in one chart.
- Provide a simple indicator to know when a trend starts and stops.
- Create a protection device so as to not lose money during a bracketed, range-bound market.
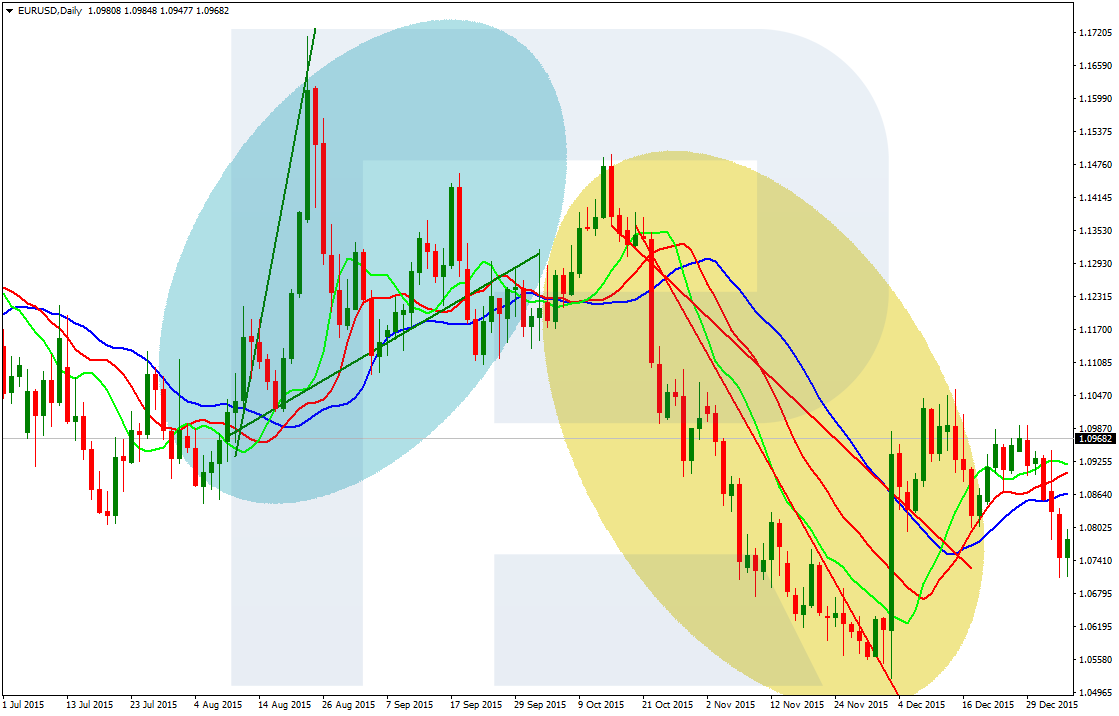
What is the alligator?
Basically, the Alligator is a combination of balance lines using fractal geometry and nonlinear dynamics. The blue line that is called the Alligator’s jaw is the balance line for whatever time frame is on the chart. The (blue) balance line is where the market would be if there were no new incoming information. The distance between this line and the current price is an indication of how the traders interpret this new incoming information. The red line (the Alligator’s teeth) is the balance line for one significant time frame lower.
Significant in this case is approximately one-fifth of the time frame on the chart. So, roughly, if the time frame on the current chart is daily and refers to the Blue Line, the Red Line would approximate an hourly chart. The green line (the Alligator’s lips) is the balance line for still another significant time frame lower. Again, it would be approximately one-fifth of the time frame of the red line. So, if the chart we are examining is daily, the red line would approximate the hourly chart and the green line would approximate a 5 to 10-minute chart.
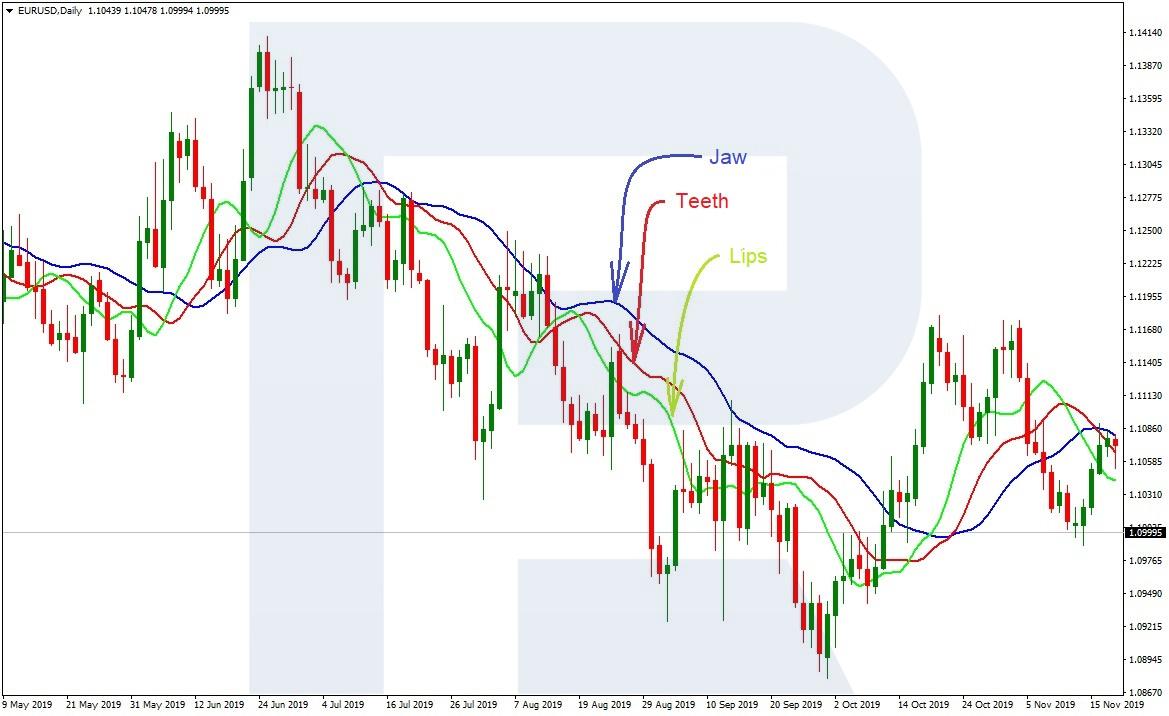
Putting this another way, the blue line is where the market would be on the daily chart, the red line is where the market would be on an approximately a one-hour chart, and the green line is where the market would be on an approximately 5- to 10-minute chart. Remember these time values are approximate and not connected to clock time. New incoming information would first affect the green line, followed by the red line and finally by the blue line.
Construction of the Alligator
- Blue Line—a 13-bar smoothed moving average offset 8 bars into the future
- Red Line—an 8-bar smoothed moving average offset 5 bars into the future
- Green Line—a 5-bar smoothed moving average offset 3 bars into the future

When the Alligator’s lines are intertwined, it is asleep, which means that the market is range-bound. The longer he sleeps the hungrier he gets.
When he awakes from a long sleep, he is very hungry and chases the price (Alligator food) much farther because it takes more prices to fill his stomach.
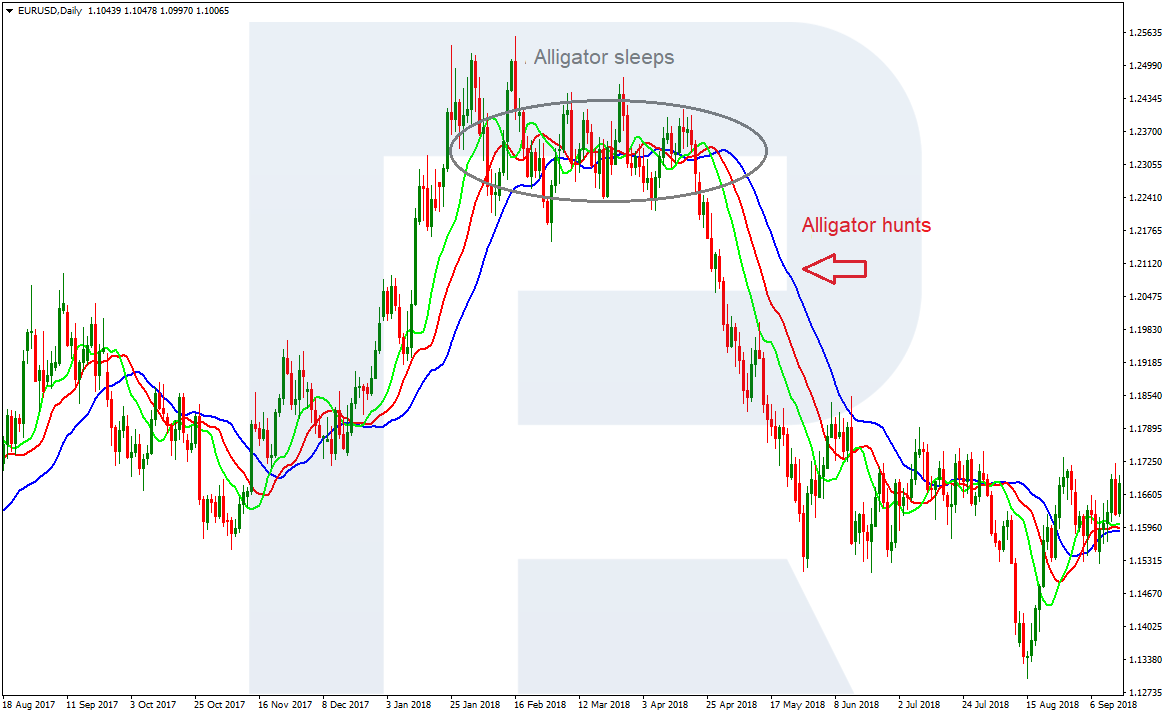
Bill Williams didn’t recommend to trade while the Alligator is sleeping, but believed that traders should look for signals when it awakes. Hunting Alligator is the finest hour for traders to increase profits.


The first wise man
The first wise man is the best tool for entering the market; it’s the first countertrend signal. The first wise man is the bullish/bearish divergent bar.
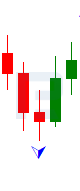
The bearish divergent bar
The bearish divergent bar is a bar that has a higher high and closes in the lower half of that bar.

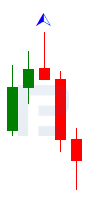
The bullish divergent bar
A bullish divergent bar is a bar that has a lower low and closes in the top half of the bar.

Angulation
When the price is moving at a steeper angle than the Alligator, it is called angulation. Angulation is an additional argument when looking for a divergent bad to enter a deal or a series of deals.
Rules for angulation
- The price bars cross or go through the Alligator’s mouth (jaw, teeth, and lips).
- Draw or imagine a line that follows the Alligator’s mouth but pay attention to the jaw and teeth more than the lips.
- Draw or imagine another line that basically follows the edges of the price bars. You would look at the bottom edge of the prices in an up move and the top edge of the prices on a down move.
- If those two lines show clearly that they are moving away from each other, you have angulation.
Entrance strategy
On a bullish divergent bar, we place the buy stop 1-2 pips above the top of the bullish divergent bar and on the bearish divergent bar, we place our sell stop 1-2 pips below the bottom of the bearish divergent bar.
A very important moment: if the order fails (a signal bar isn’t broken) through the next two bars, you should delete a pending order and consider the bar false. Also, if the signal wasn’t broken, then the opposite bar was broken instead of it (low/high, depending on a signal bar, bullish or bearish).
Exit strategy
Once our buy or sell stop is hit, we need a protective stop. The first protective stop would be placed just below the bullish divergent bar or just above the top of a bearish divergent bar.
Once that signal is hit, we place a stop and reverse on the following bar. In the case of a bullish reverse, sell stop is placed below the bottom of the bar. In the case of a bearish reverse, buy stop is placed above the top of the bar.

The second wise man: adding on with momentum
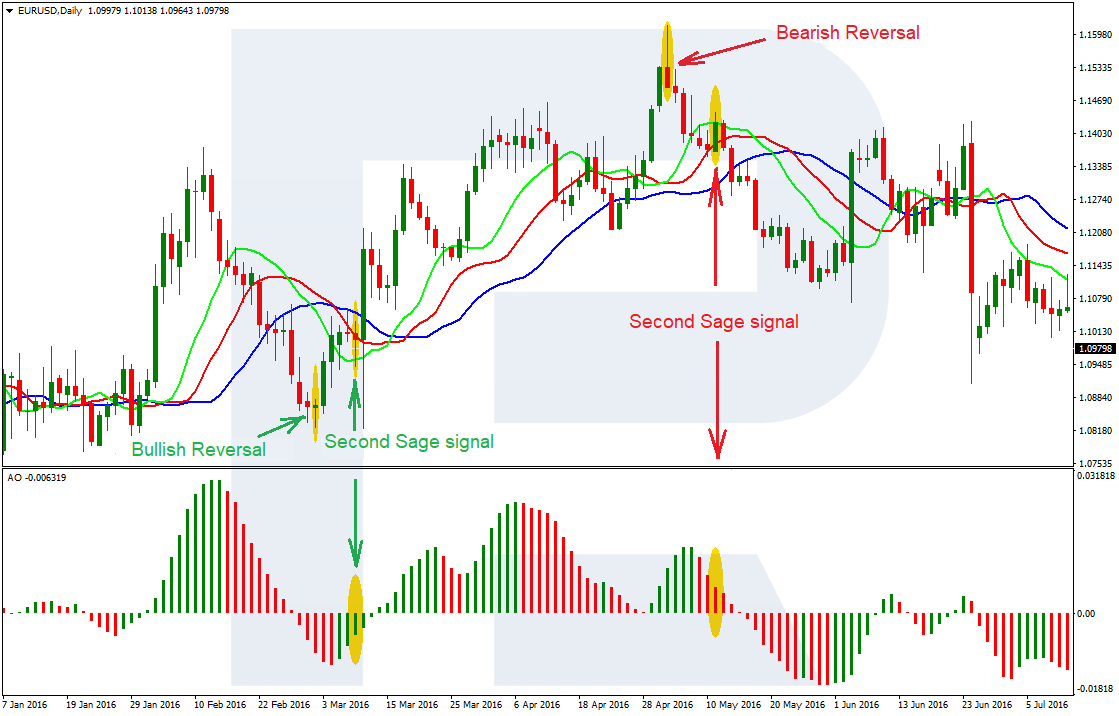
Awesome Oscillator
The second entry signal is based on the Awesome Oscillator (AO). Basically, it is a 34-bar simple moving average that is subtracted from a 5-bar simple moving average. The Awesome Oscillator is an improved Market Facilitation Index (MFI). Assume that you have entered a trade at the direction of the first wise man (the bullish/bearish divergent bar), and the market is now moving in your direction. The next question should be, do I add on and if so where would be the most appropriate place?
The second wise man buy signal is formed after the buy signal in the form of a bullish reverse. It looks like the third straight green histogram bar. Buy stop should be placed 1-2 pips above the top of the signal bar.
The second wise man sell signal is formed after a bullish reverse. It looks like the third straight red histogram bar. Sell stop should be placed 1-2 pips below the bottom of the signal bar.
The third wise man: trading the fractal breakaway trade
The Fractal signal is usually the third entry point, although if an appropriate fractal appears before the wise men 1 and 2, we would still place a trade on that Fractal.
We’ve already talked about models and forms of fractals in previous articles, but only buy and sell fractals are interesting for us in trading.
Once a Fractal signal is formed and is valid in relation to its position outside the Alligator’s mouth. The Alligator helps to distinguish true fractals from false. A true buy fractal is the one with the signal bar formed and closed above or at the Alligator’s teeth. A true sell fractal is the one with the signal bar formed below or at the Alligator’s teeth.
Buy stop should be placed 1-2 pips above the top of the signal bar of the true buy fractal. Sell stop should be placed 1-2 pips below the bottom of the signal bar of the true sell fractal. Every new true buy or sell fractal requires moving the pending order to a more favorable level.
What happens when the wise men get together?
Now that we understand all the three wise men, let us go a bit deeper and learn how to respond most profitably to various setups that the market gives us. A classic First we examine the pristine setup, where we enter the market in the following order of market-generated signals:
- Bullish/bearish divergent bar
- Super AO—three consecutive bars of the same color
- A Fractal signal
All orders are equal in volume (for example, 1 lot).
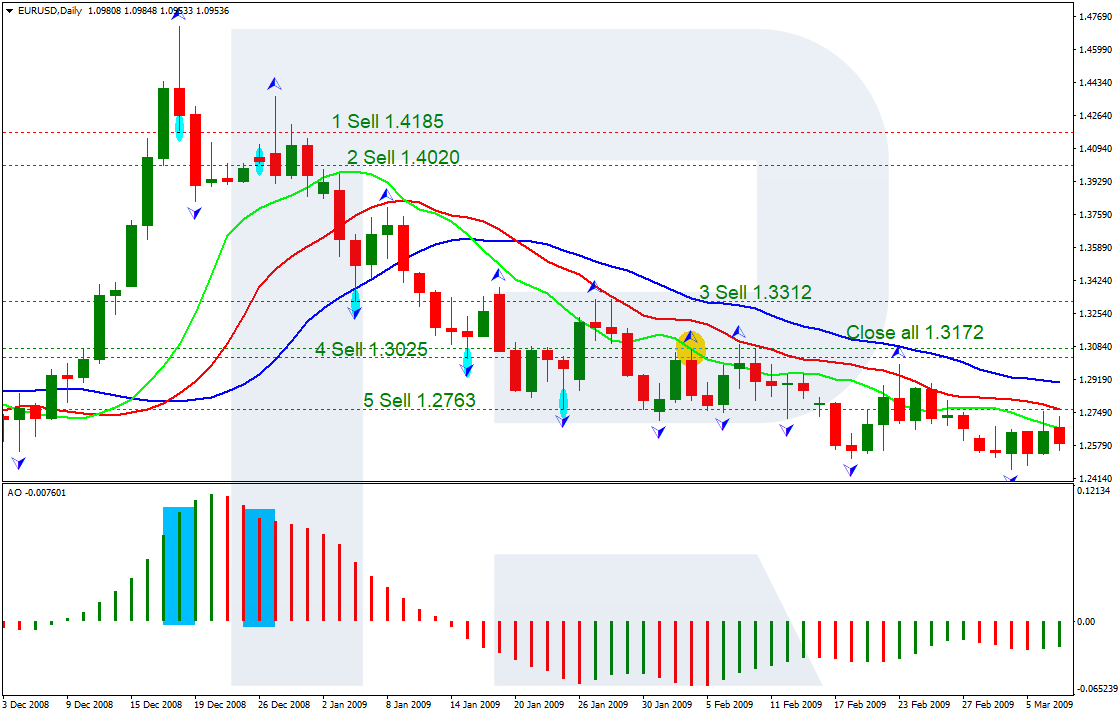
Example
- The first wise man (bearish divergent bar) was formed after a strong impulse to the upside with good angulation. The AO histogram was green. Sell signal was hit at 1.4185.
- The second wise man (the third red bar of the AO histogram) was formed on the fifth day after the first wise man. Sell signal was hit at 1.4020.
- The third wise man (fractal) appeared in the trend several ties: the third sale was at 1.3312, the fourth – 1.3025, the fifth – 1.2763.
If we participated in such a series of orders and moved Stop Loss along fractal highs (it’s the key exit strategy according to the Trading Chaos strategy), then our exit would be at 1.3172.
Results
- The first wise man profit – 1,013 pips or 10,130$
- The second wise man profit – 848 pips or 8,480$
- The third wise man profit: the 1st fractal – 140 pips or 1,400$
- The third wise man loss: the 2nd fractal – 147 pips or 1,470$
- The 3rd fractal – 409 pips or 4,090$
10,130+8,480+1,400-1,470-4,090=14,450$
This is how much money we can make if reading the market’s hints correctly and respond to them timely.
Reverse Pyramiding – money management at maximums
Reverse Pyramiding is a pretty aggressive way to manage your funds and Bill Williams didn’t recommend it to novices. However, if you’re not, it’s one of the best ways to maximize your profit. So, what’s the point? Williams recommends to open the first position using the minimum amount, 1-2% of your capital because it’s the moment when you risk the most and try to check our hypothesis about future market behavior. As soon as the first position becomes profitable, the second wise mand appears and we can increase aggressively. The position volume for the second signal should be four times bigger than the previous deal. In case the third wise man (fractal) appears, the position volume will be three times more than the first one. When another fractal appears (the fourth deal), the position volume should be increased twice in comparison with the first deal.
Such a “jump-ramp”-like model allows one to receive the most from the market movement in the very beginning and cover possible losses from the last deals in the case of a reverse. Let’s get back to our example, but reshape it based on the Reverse Pyramiding principle.
For example, the volume of our first deal is 1 lot.
- The first wise man profit – 1,013 pips or 10,130$;
- The second wise man profit – 4*848 pips or 8,480$;
- The third wise man profit: the 1st fractal – 3*140 pips or 1,400$;
- The third wise man loss: the 2nd fractal – 2*147 pips or 1,470$;
- The 3rd fractal – 1*409 pips or 4,090$.
(1*10130)+(4*8480)+(3*1400)-(2*1470)-(1*4090)=41220$.
The final result of using the Reverse Pyramiding principle is several-fold larger than the previous one.
Afterword
All books, ideas, and reflections of Bill Williams influenced not only me, but a lot of other traders, and provided us with the opportunity to trade on the market and get profit with pleasure and without stress. I believe his works are “must read and learn” for all beginners.
I hope that articles from our blog will reveal the market novices and motivate them to read the books written by this outstanding person.
On May 24th, 2019, Bill Williams passed away. However, he not only made a mark on the world but left an excellent legacy and a great number of disciples.
Thanks a lot, master!


