The Woodies CCI Strategy: Trading Without Price Charts

7 minutes for reading
The Woodies CCI is a trading method, created by Ken Wood, is a very simple system. It is even said that for using this method successfully, trading by the rules suggested by the author is enough. Earlier, we described the Turtle system, in which some students had also failed to succeed because they ignored some rules and skipped signals. Here, Woodie offers a whole set of rules: the trader only needs to follow them.
The work consists of searching for graphic patterns, drawing trendlines, and watching the breakouts of horizontal lines right on the indicator chart. I must note that we can do something similar with the RSI: we draw trendlines and receive leading signals in the case of a breakout right on the indicator chart; on the MACD, we search for graphic patterns, such as Head and Shoulders.
Description of the Woodies CCI indicator
Initially, the system was meant for trading CFDs, but with time traders started using it for other market types as well. Likewise, many other systems were originally designed for the stock market but are now successfully used on Forex market.
The system is based on two CCI indicators with different parameters. The instrument itself uses the cycles of price movements — in detail, you can read about the CCI in the blogpost below.
For the Woodies CCI strategy, the author takes two indicators with periods 14 and 6 and places them in one window. The first chart is called CCI and the second one — CCI Turbo. The latter is used for finding entry and exit signals.
Defining the trend with Woodies CCI
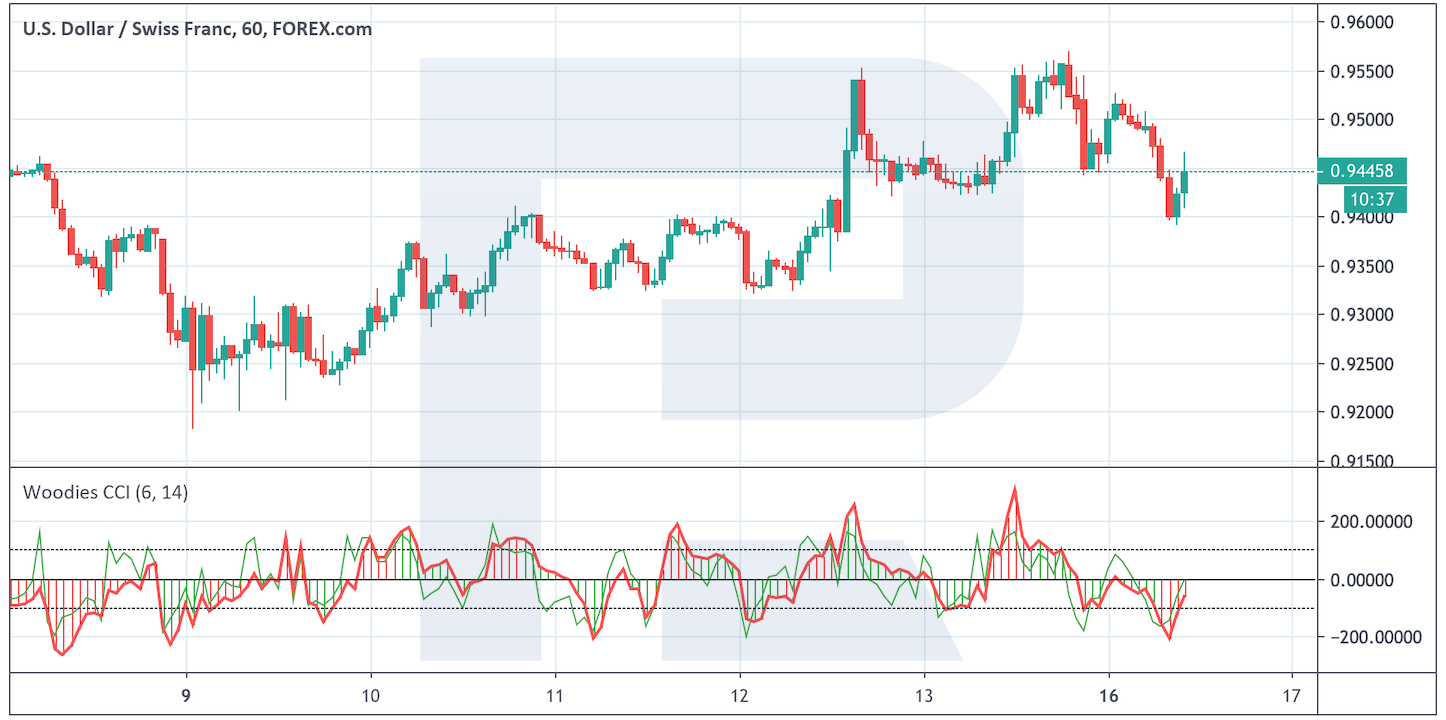
The system is meant for trend markets, hence, trades are opened in the direction of the prevailing trend. To define the trend, the system uses a histogram.
If the bars are above zero and green, the trend is ascending. If they are below zero and red, the trend is descending. Note that the color of the bars does not change right after crossing zero; six subsequent bars above or below zero are required for the color to change.
How to trade Woodies CCI?
Many traders think that the signals of the system are high-quality. Here, you do not need to think too much as when trading classical graphic patterns, say. All entry and exit signals have a clear description.
Moreover, you do not have to predict price movements by thus indicator only. Also, the system does not offer levels for the Take Profit, however, it is an advantage when trading the trend because no one can tell how much the price may drop or grow. We simply open a position and let the profit grow. Meanwhile, it is recommended to place the Stop Loss as close to the price as possible, its size depending on the entry point.
Trend signals of Woodies CCI
As in any other method, the signals in the direction of the main trend are executed by the market better than any other one. Trading counter the trend entails serious risks, and you need to exit the trade quickly if the prices turn against us. The author recommends getting acquainted with the system by trading the patterns going alongside the trend as they have a higher probability of execution. As soon as you start making a profit on signals along with the trend, you may try using signals counter the trend.
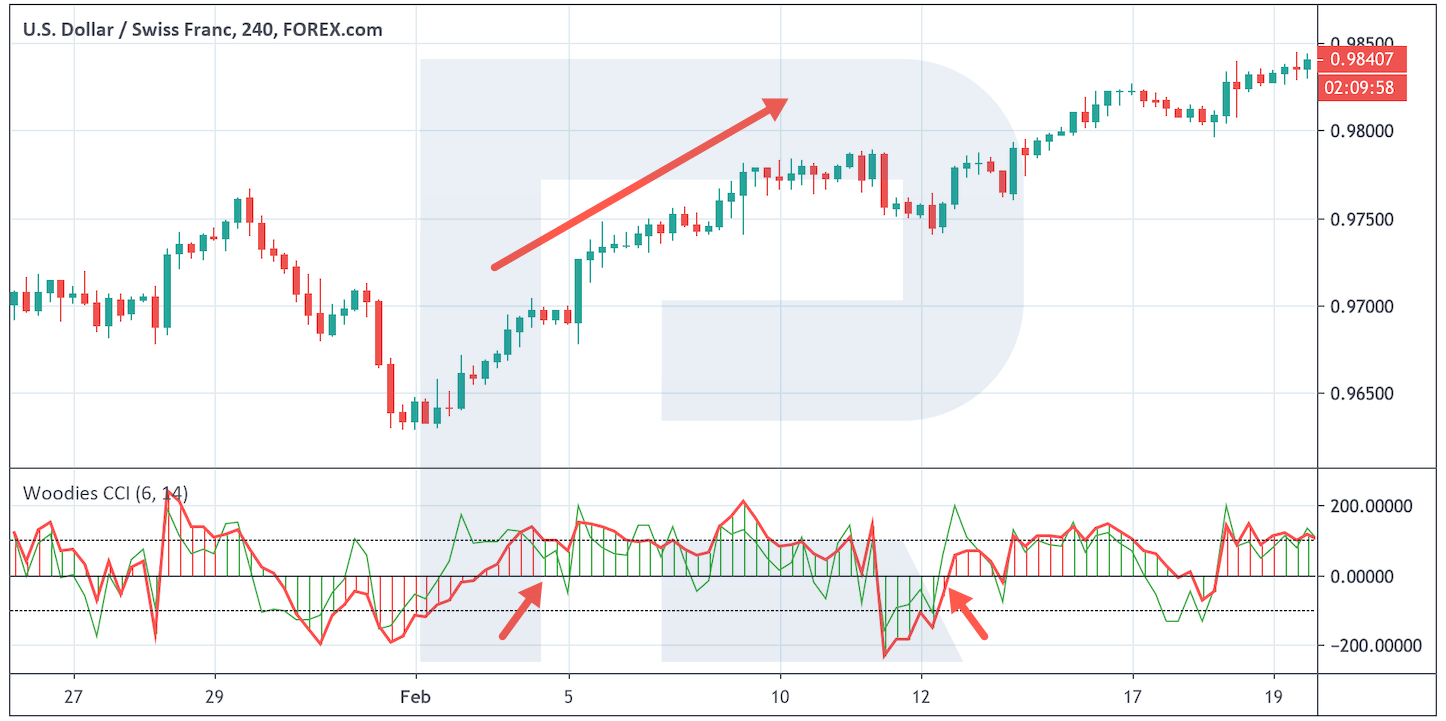
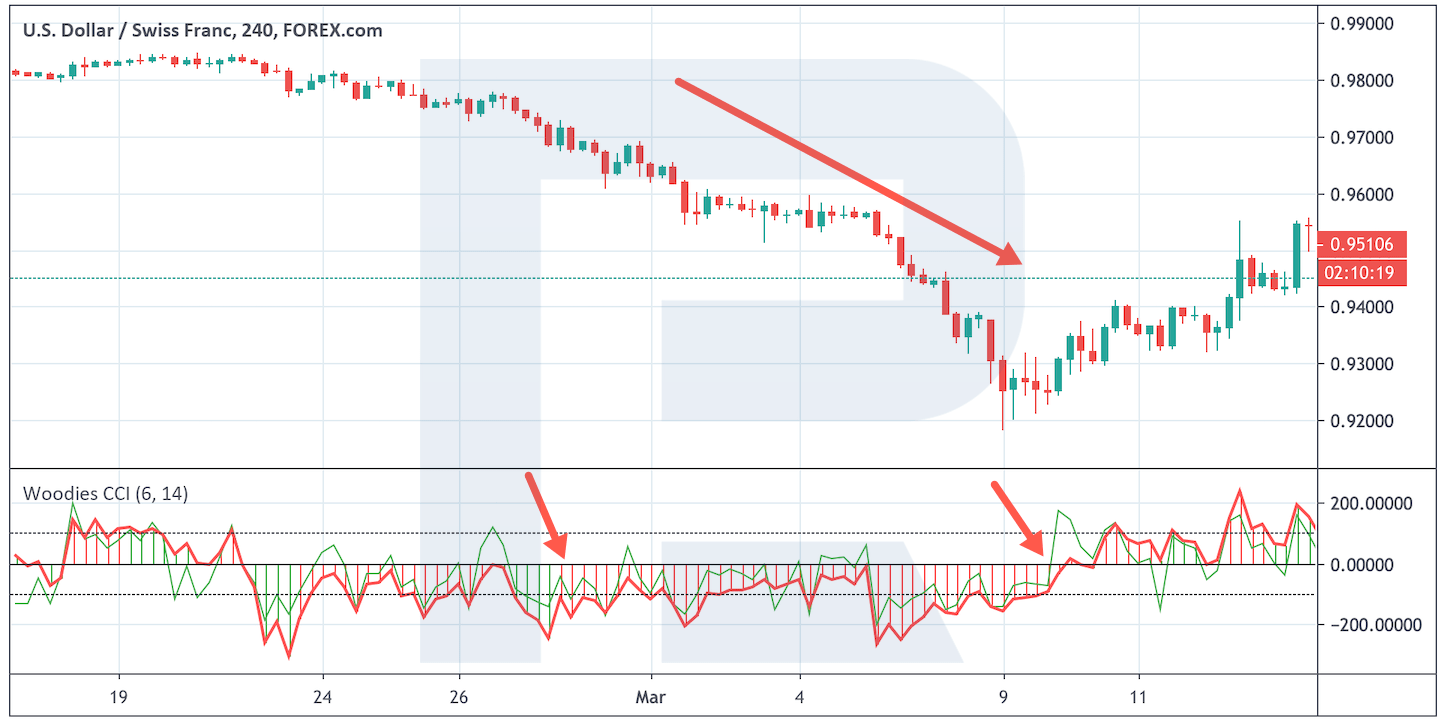
A bounce off the zero line
This one is considered one of the main signals. It is formed a the moment when the indicator defines the trend and then the CCI values return to the zero line. It may be not just a touch but a minor test, after which the indicator reverses. This movement confirms the trend, the market is to be entered here.
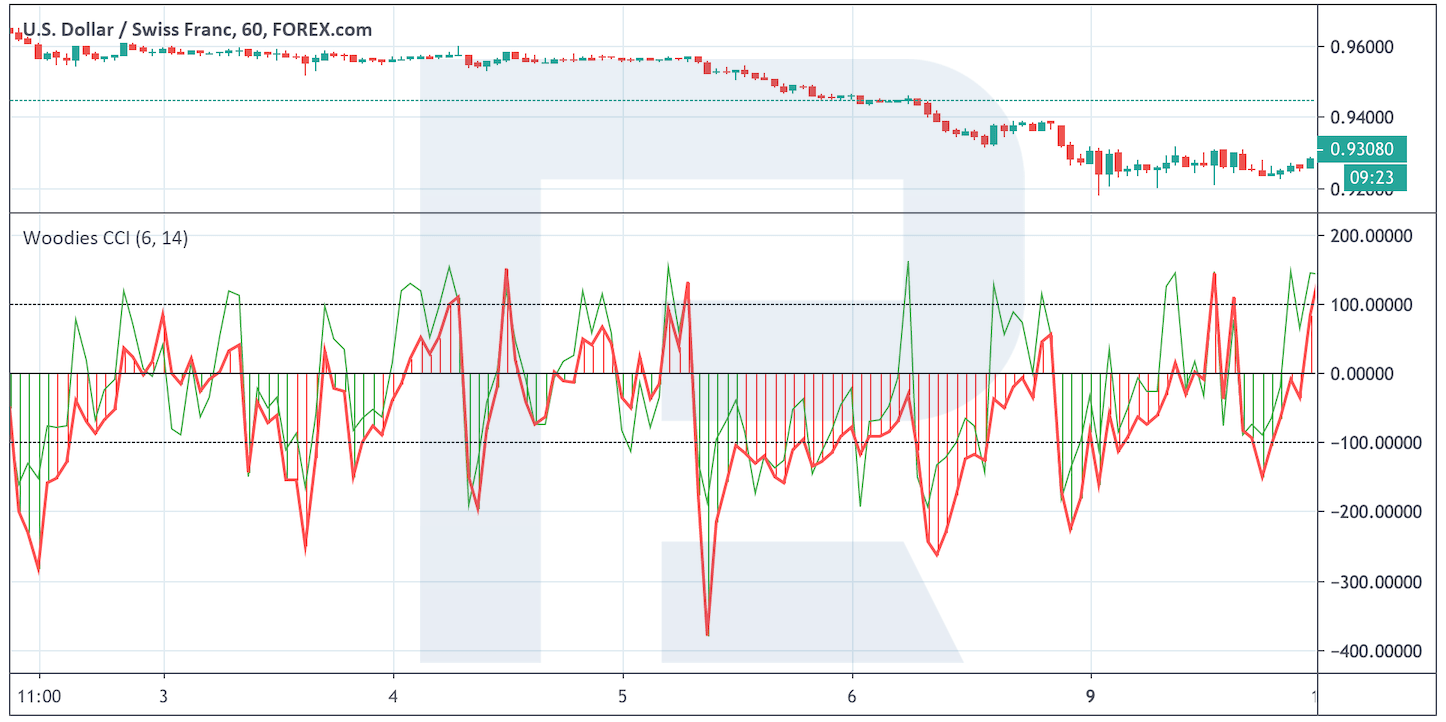
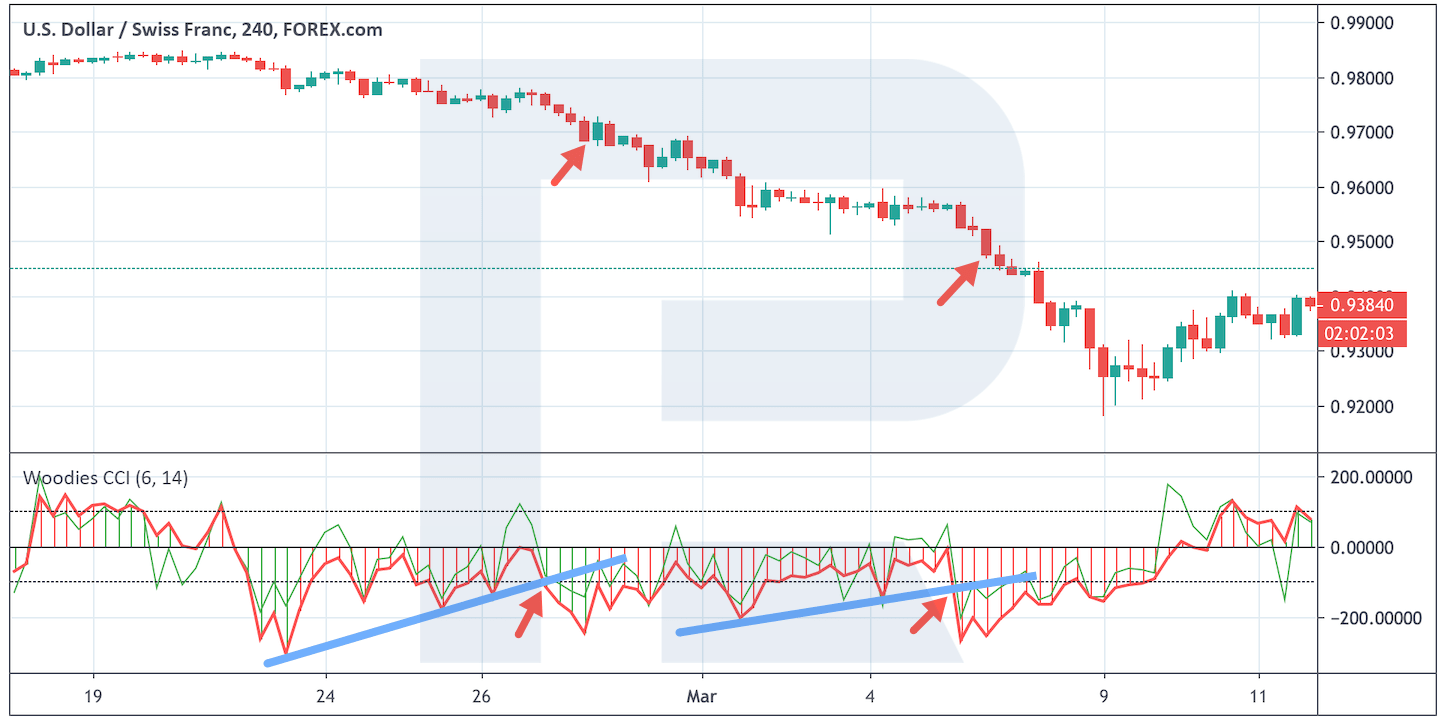
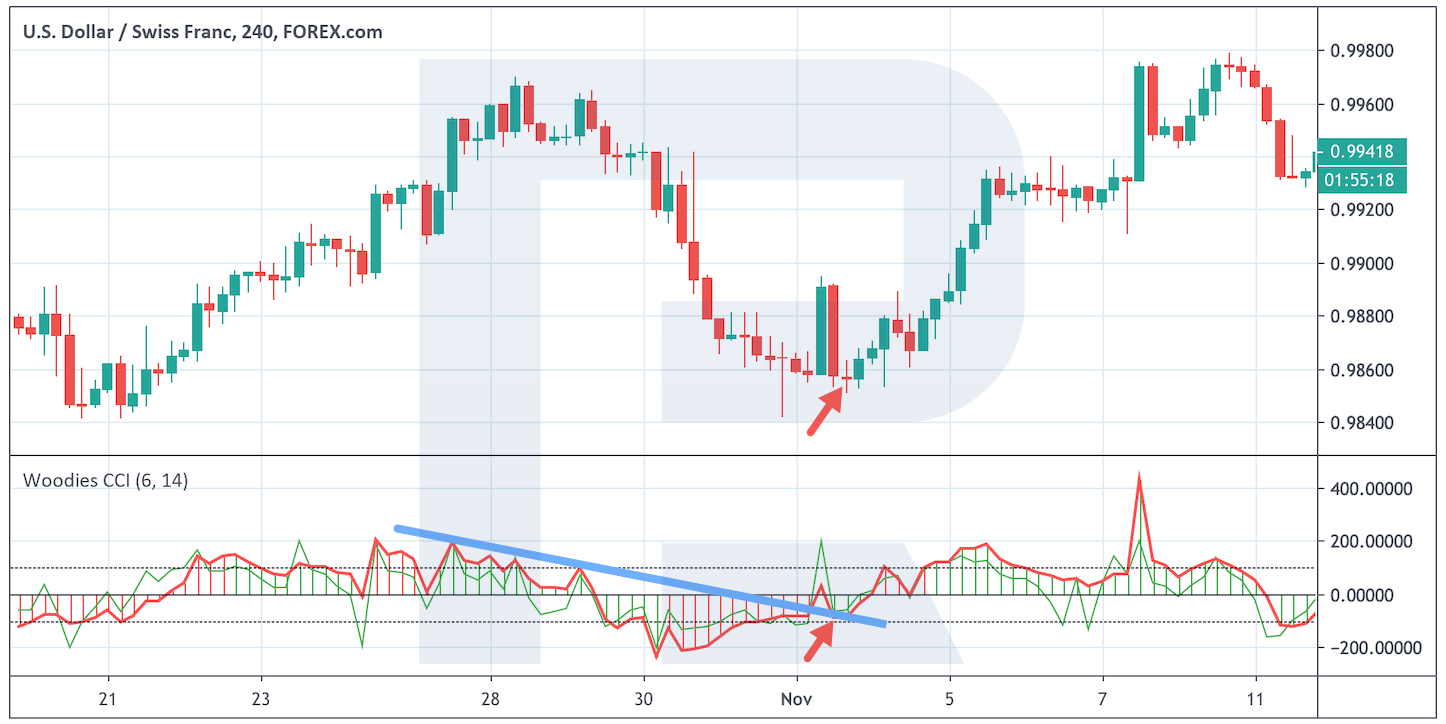
A breakout of the trendline
Such a line is drawn through pronounced peaks as an ordinary trendline. It is sometimes said that this line may be drawn only if the indicator values have gone above or below 200, in other cases the movement is not strong enough for drawing such a line. The best entry point is a breakout of the trendline as close to the zero line as possible, which will also be an additional signal of a bounce.
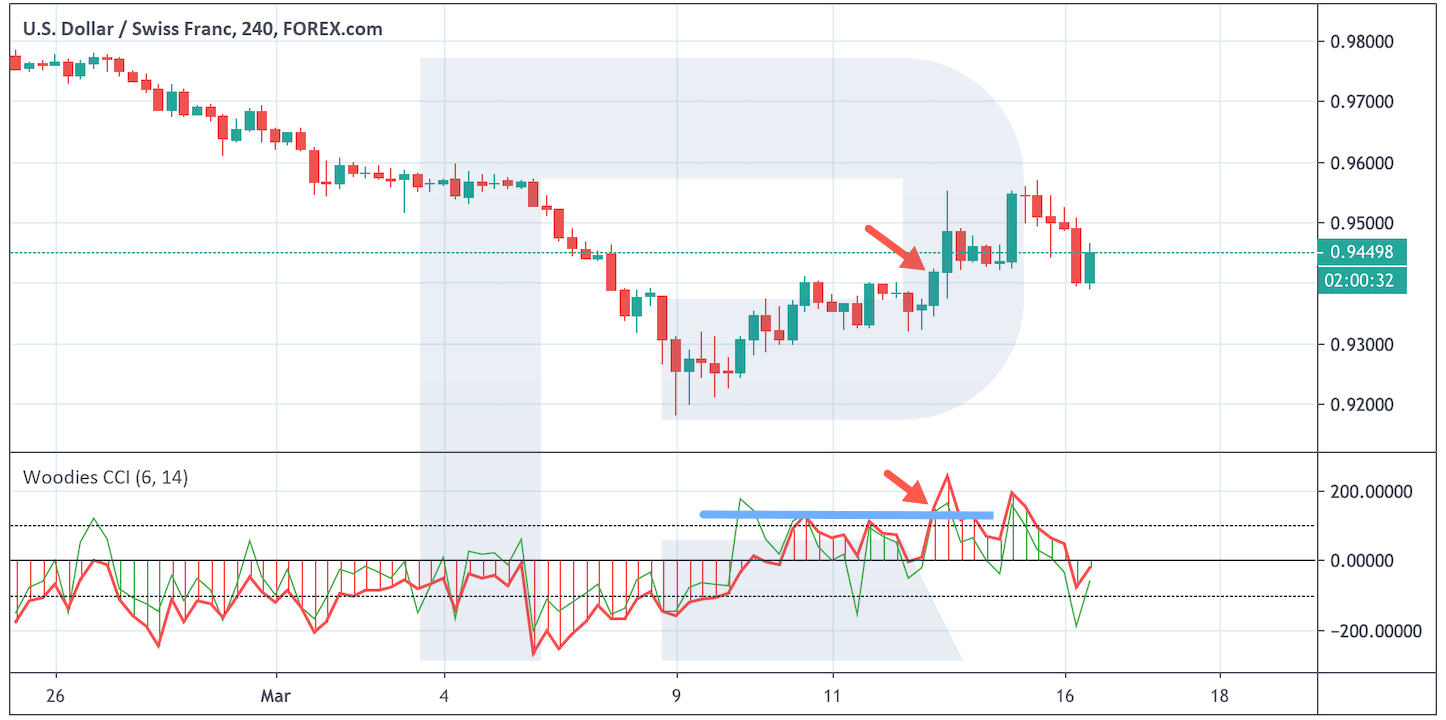
A breakout of the support or resistance level
The horizontal line is drawn till the level 100; a breakout of such a line provokes further price movement along with the trend. A strong signal will have more than two peaks before the breakout. This signal is thought rare. You may enter the market on the candlestick that follows the breakout of the horizontal level.


Exiting the position by Woodies CCI
Note that the signals to exit the position that we have opened along with the trend may be interpreted as signals to open a position counter the trend. Please, remember that such positions will be very aggressive and control the risks, perhaps enter such a trend with a much smaller lot than when working along with the trend.
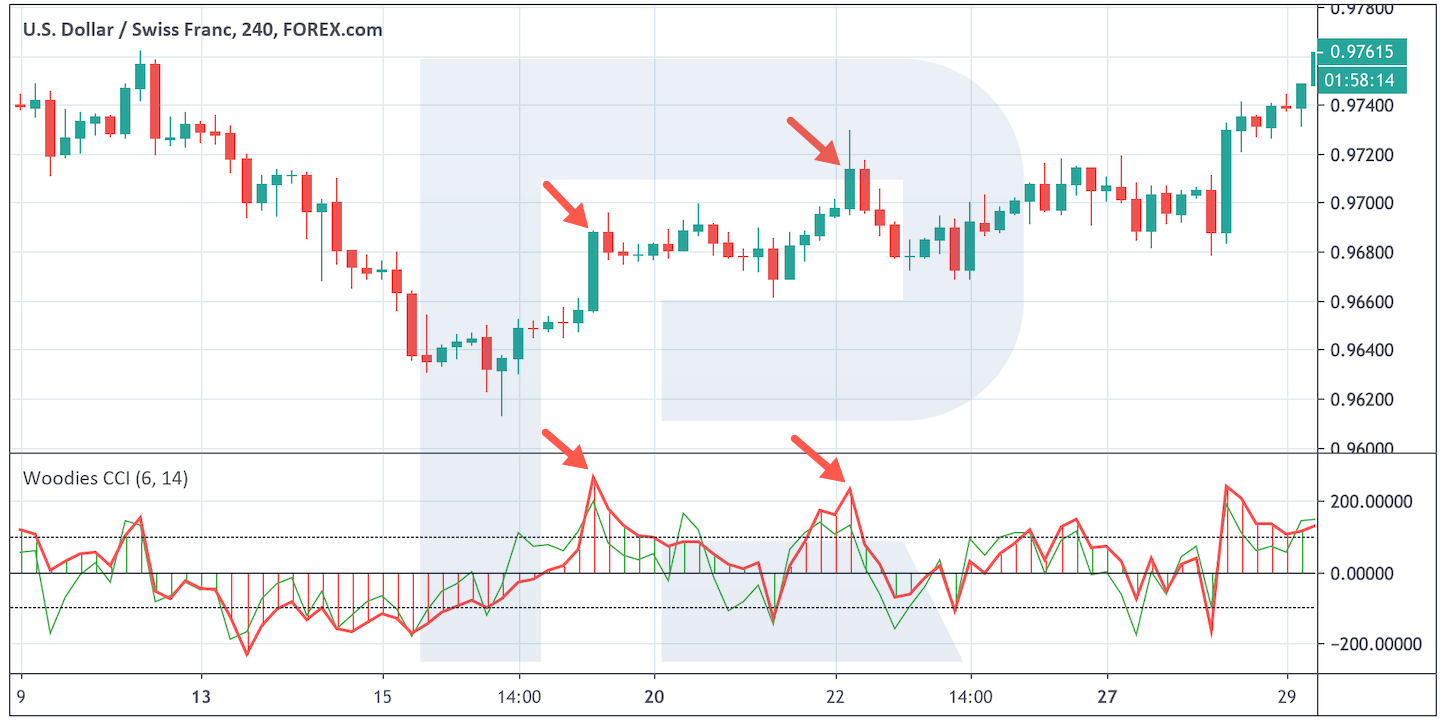
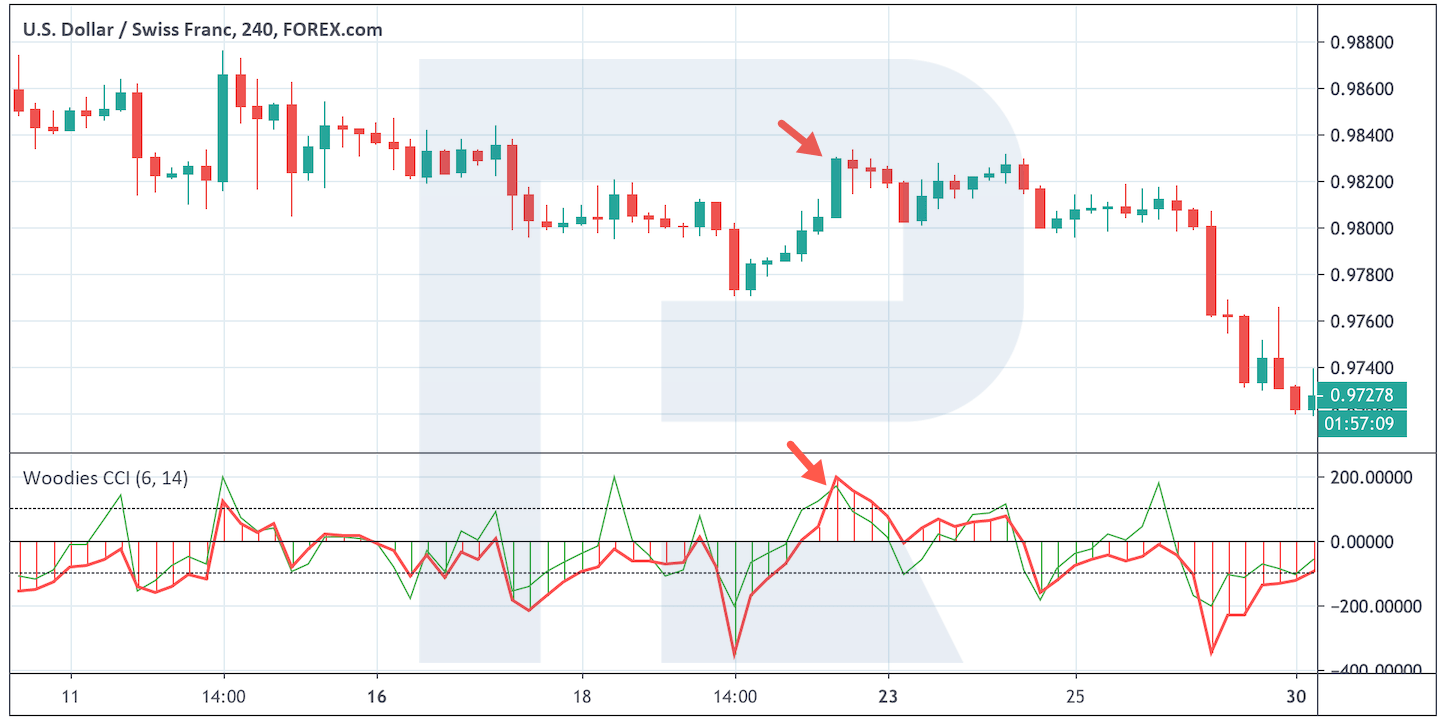
A quick return from a level above 200
We may single out such a signal as the formation of a "V-shaped top". As a rule, at the moment of a strong impulse, the values may leap above 200 and quickly reverse, forming a hook that resembles the pattern of the classical tech analysis. This will signal a slow-down of the impulse and the beginning of a correction — a good moment to exit the market. Alternatively, we may enter a trade counter the trend.
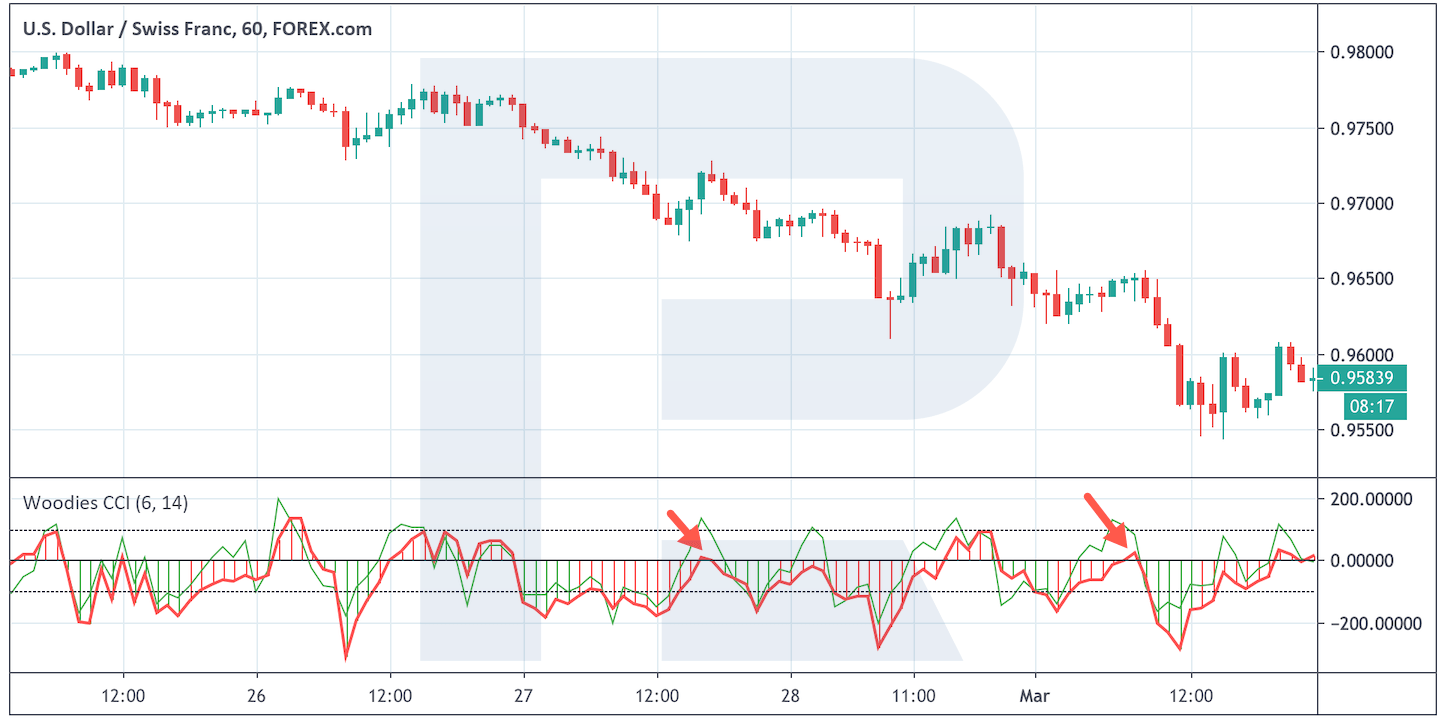
The crossing of the quick and slow CCIs
The system uses the indicator with different timeframes, of course, they sometimes cross. If we mean a bullish trend, it is important that the quick line broke the slow one from above, which will also signal a slow-down of the trend and the beginning of a correction or even a reversal. For us, such a crossing will signal a good time for closing the position. This signal may be compared to the crossing of two Moving Averages, signaling a change of the trend.
A breakout of the trendline
Here, we draw a trendline based on the movement of the indicator inside the last impulse. A breakout of such a line will signal the end of the impulse, which will be a good chance for us to exit the market at the highest prices. Note that this signal may also advise entering the market.
Summary
As we see, the author of the system Ken Wood offers a very interesting trading method. It may not be called unique: not only the Woodies CCI system does without a price chart. The same principles are featured by the RSI indicator: trendlines, patterns, and breakouts of the horizontal levels are similar.
However, the approaches are different. All that the trader needs working with this system is to wait for the patterns to form and enter the market strictly by the signals received. Most traders advise against adding anything to the system, the default set is enough for profitable trading. However, if you see some unusual signals from Woodies CCI, try using them.


