How to Trade by Scalping Parabolic SAR + CCI Strategy

6 minutes for reading
Recently, we have discussed several long-term trading strategies that call for the trader’s attention to the price chart quite infrequently. However, such a trading style does not suit all investors: some want to trade here and now, seeing the results immediately.
One advantage of a short-term strategy would be relatively low risks, because movements on shorter timeframes are much smaller than on longer ones.
The trading tactics that we will discuss are based on two indicators – Parabolic SAR (SAR) and Commodities Channel Index (CCI). Trading goes by the trend on M1 and M5. The trend will be demonstrated by the Moving Average (MA), one of the best trend indicators.
This article is devoted to using these three indicators for scalping on minute timeframes and placing the Stop Loss and Take Profit.


How to set up the indicators
The strategy is meant for trading such currency pairs as EUR/USD, GBP/USD, and AUD/USD. These are one of the most popular instruments among Forex traders. For trading successfully by the Scalping Parabolic SAR + CCI strategy, the trader will need several indicators depending on the timeframe used:
1. Exponential Moving Average (50) on M1
2. EMA (21) on M5
3. CCI (45)
4. Parabolic SAR with standard parameters of 0.02 and 0.2.
Exponential Moving Average
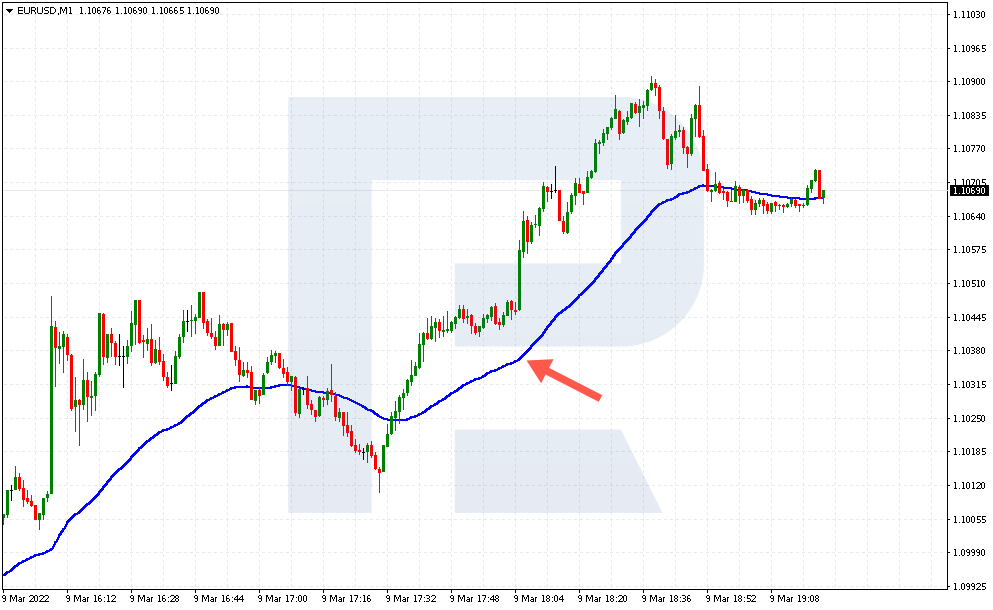
By the rules of the strategy, signals to buy form when the price is above the EMA line and signals to sell – when the price drops under the line. For M1, the MA (50) is used, and for M5 – the MA (21).
Parabolic SAR
Standard settings of the indicator – 0.02 and 0.2 – are applied. Parabolic SAR was designed by Welles Wilder, the author of the famous RSI. Initially, the indicator was called just SAR, which means Stop and Reverse.
With the new instrument, Wilder tried to solve two problems: get rid the substantial lagging that all trend indicators are characteristic of, and find the point in which the trend reverses.
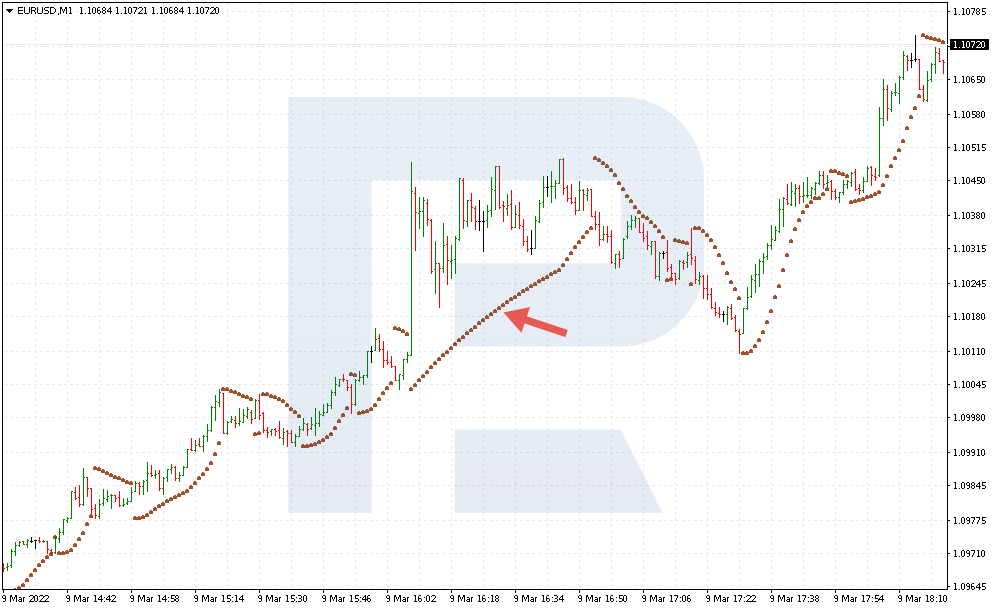
Parabolic SAR looks like a number of dots above or below the price chart. It sets the level, breaking through which the price will predict a reversal. If the price fails to break through those points, the trend is expected to continue.
Commodities Channel Index
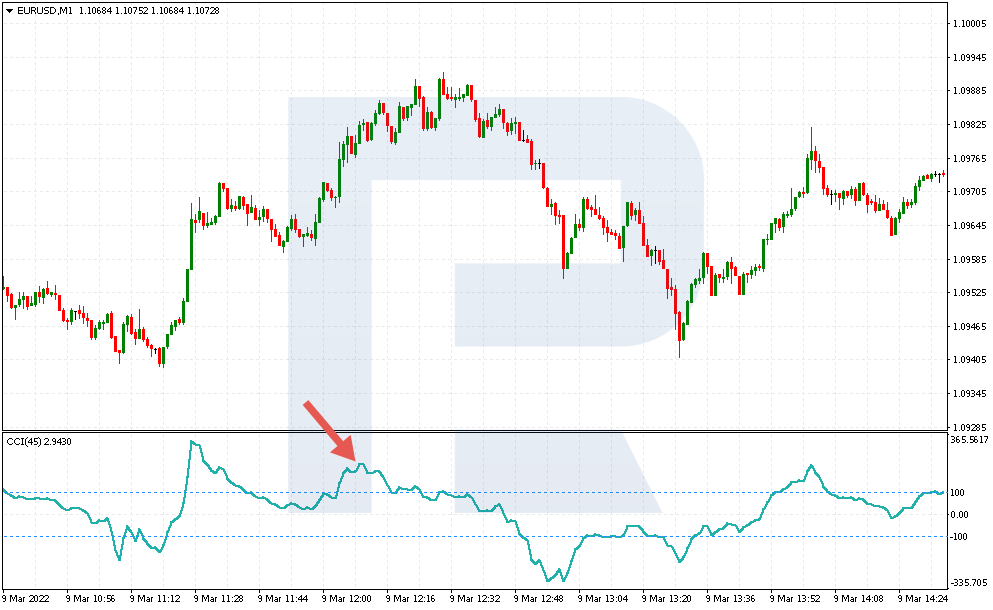
The CCI is an oscillator that shows how far the price deviates from its average values. Choose the CCI parameter for 45, and the indicator will be forming slower.


How to buy by the CCI and Parabolic SAR scalping strategy
The rules for opening a long position with the strategy are as follows:
1. Parabolic SAR values are above the EMA line. The SAR indicator still lags a bit, so the price chart will already be above the MA. Parabolic SAR will break through the MA line later. Here, the trader does not need to assess the behavior of the price, only keep an eye on the indicators.
2. CCI values are above 100, confirming a bullish impulse.
3. Take Profit is placed depending on the currency pair: for EUR/USD – between 7 and 12 points of profit, for AUD/USD – between 5 and 8 points, for GBP/USD – between 7 and 15 points.
4. Stop Loss is placed at the level of the MA. In certain cases, the loss can be larger than the profit, and such trades may be skipped.
Example of buying by Scalping Parabolic SAR + CCI
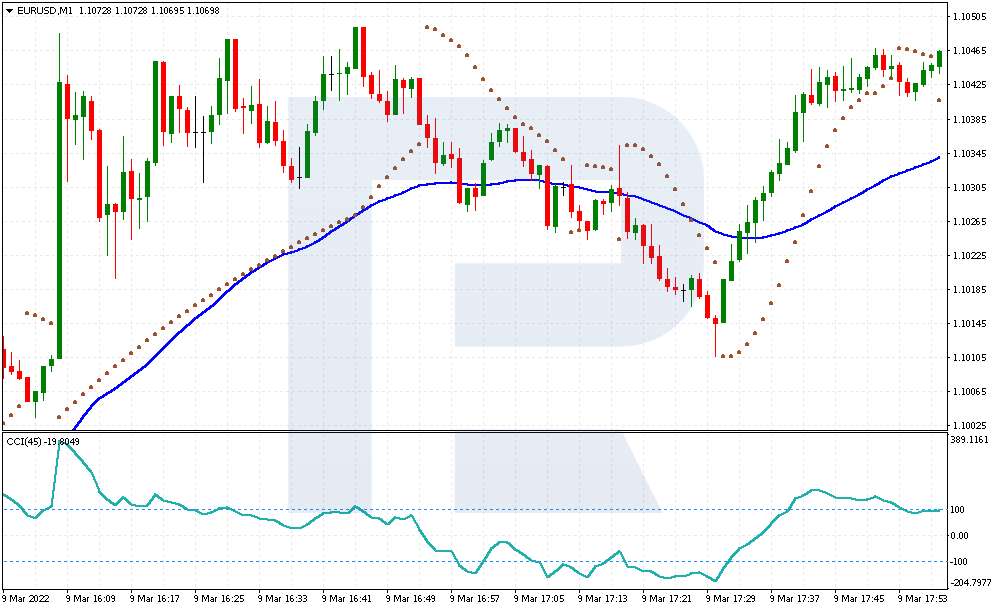
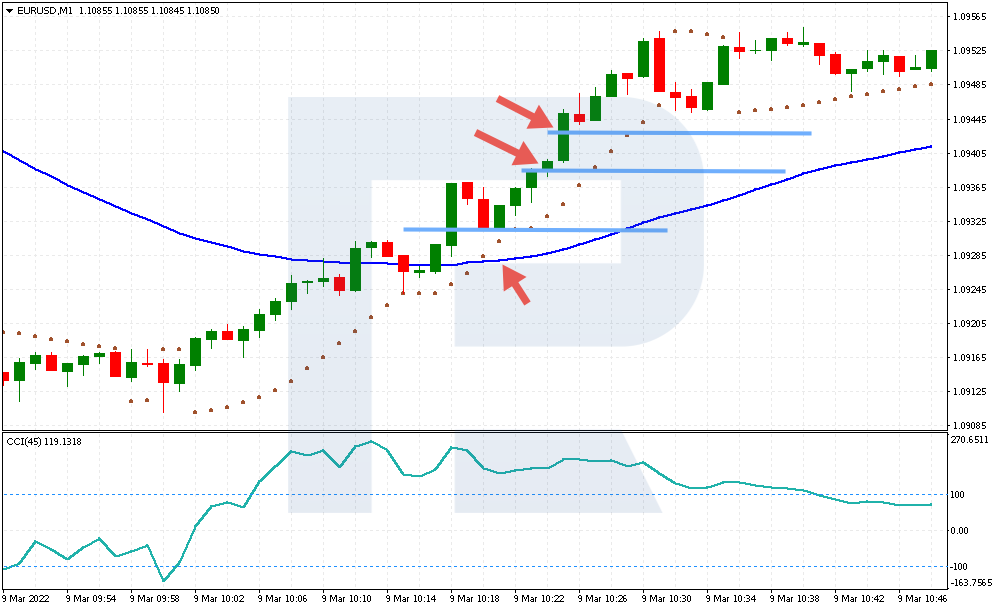
For example, take a look at the M1 of EUR/USD for 9 March 2022.
- After a lengthy decline, Parabolic SAR values broke through the EMA line and secured above it. For the trader, this was the first signal for opening a long position.
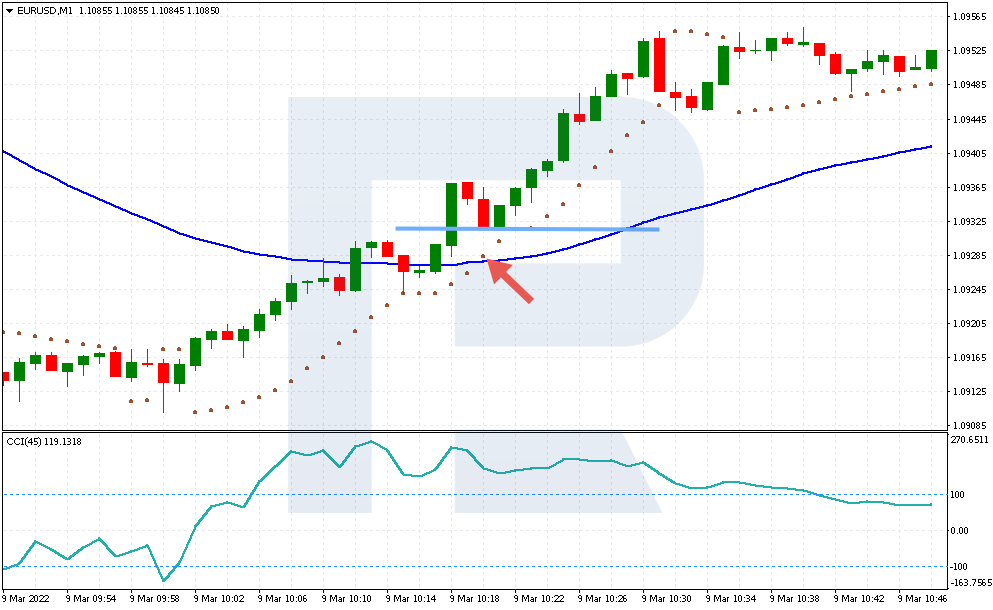
- Now to the CCI – its levels are above 100. This is the second signal for buying. The trade can be opened at 1.0931.
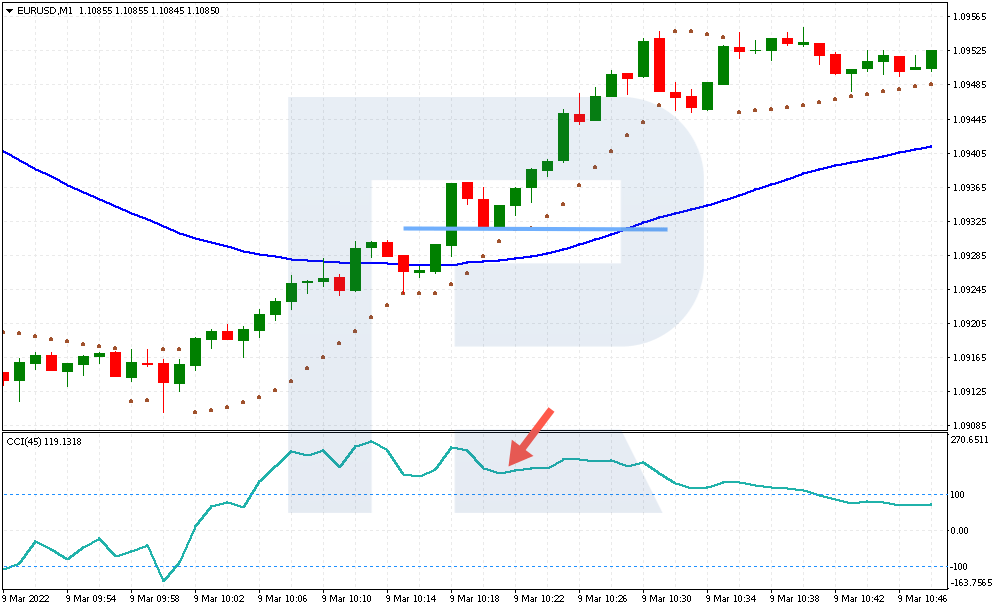
- Stop Loss is at the EMA (50) level of 1.0928. The risk is only 3 points. Take Profit by the tactics is placed 7-12 points away from the entry points. In our example, these are the levels of 1.0938 and 1.0943. The price reached those levels.


How to sell by scalping Parabolic SAR + CCI strategy
Rules for opening short positions go like this:
1. Parabolic SAR values dropped under the EMA line. The trader only needs to keep an eye on the indicator itself as it does not matter how the price chart behaves.
2. CCI values are under -100. This indicates a bearish impulse.
3. Take Profit is placed depending on the currency pair: for EUR/USD – between 7 and 12 points of profit, for AUD/USD – between 5 and 8 points, for GBP/USD – between 7 and 15 points.
4. Stop Loss is at the EMA level.
Example of selling by Scalping Parabolic SAR + CCI
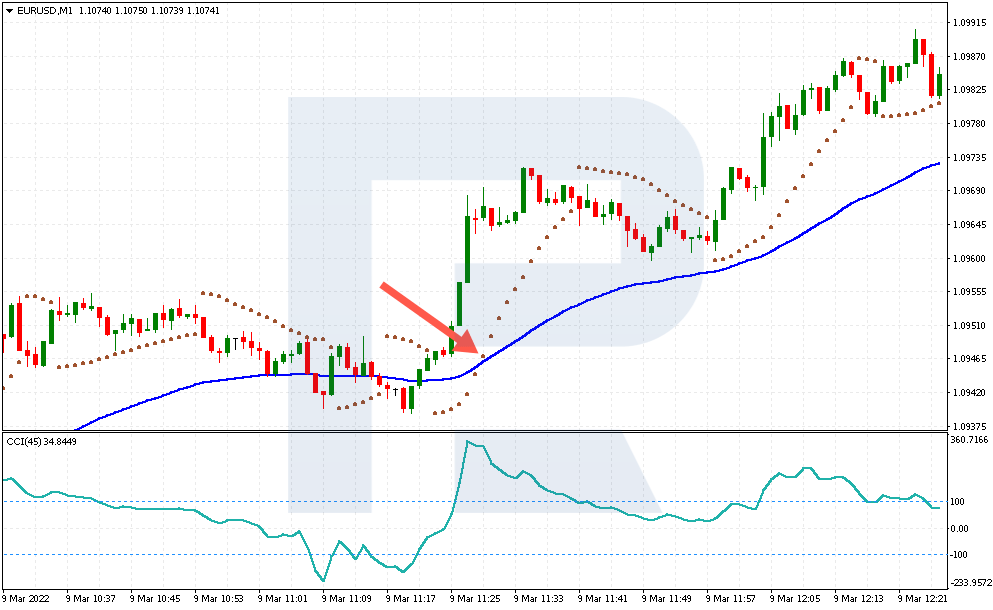
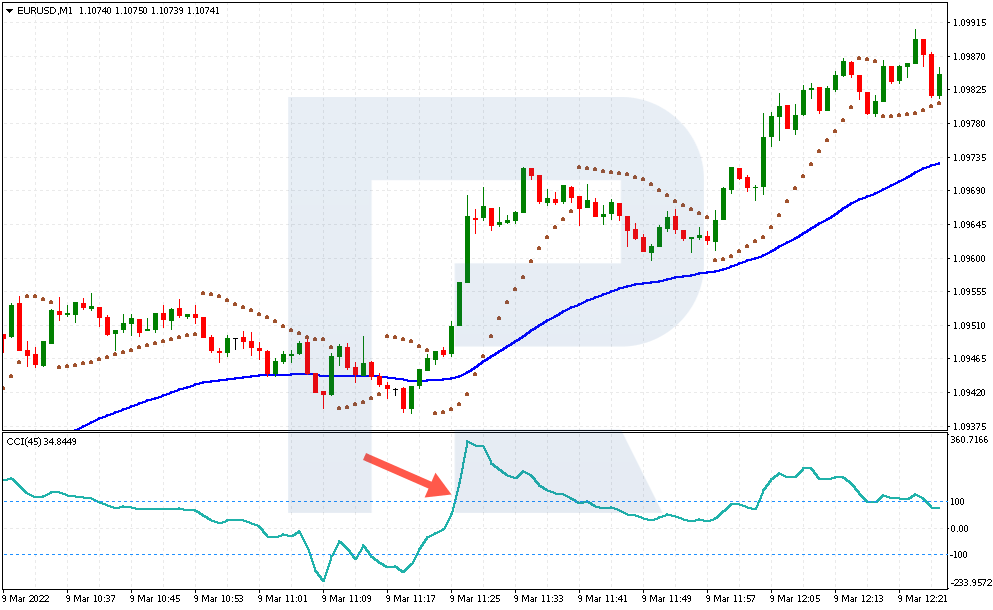
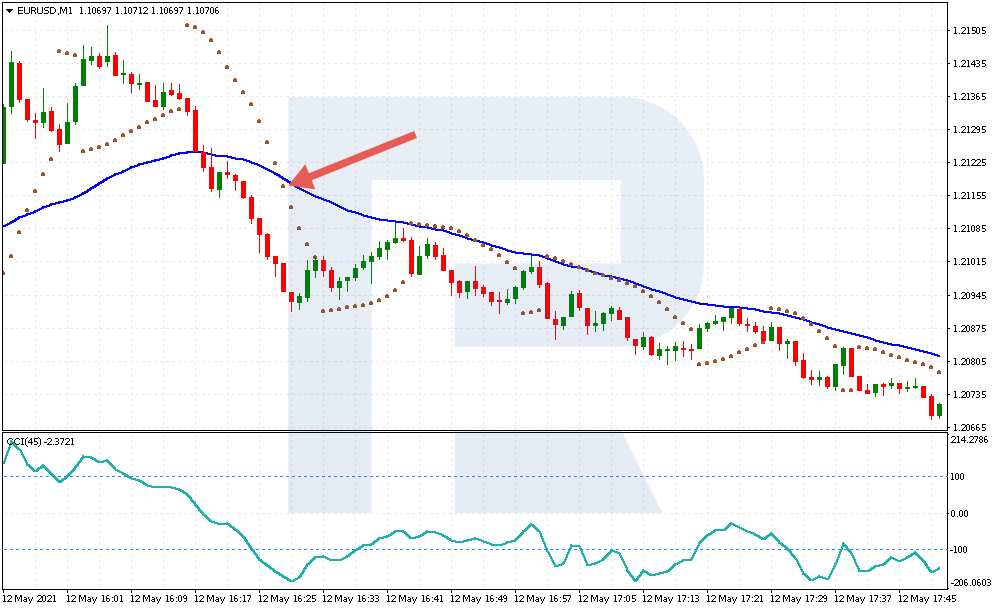
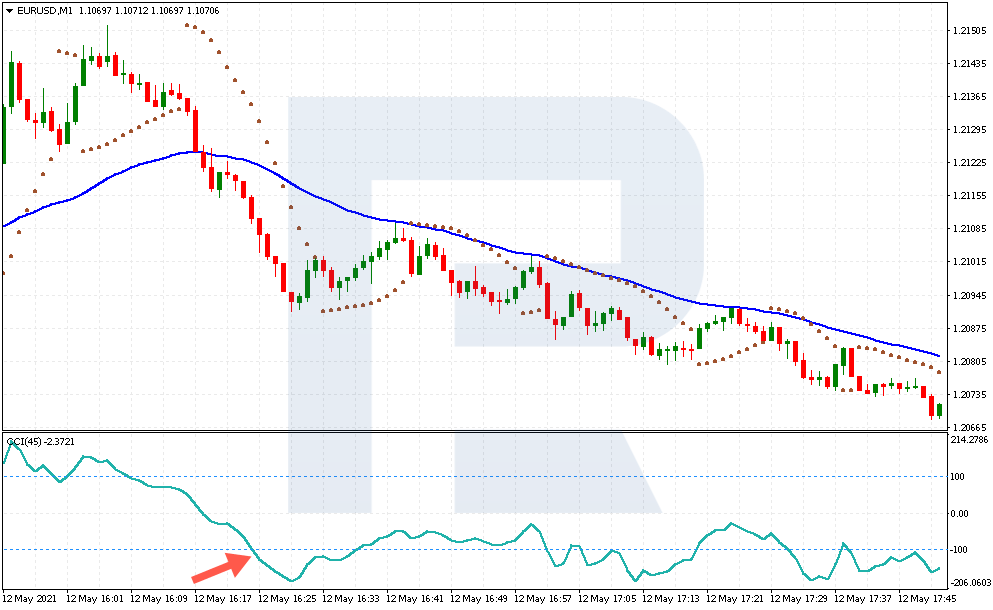
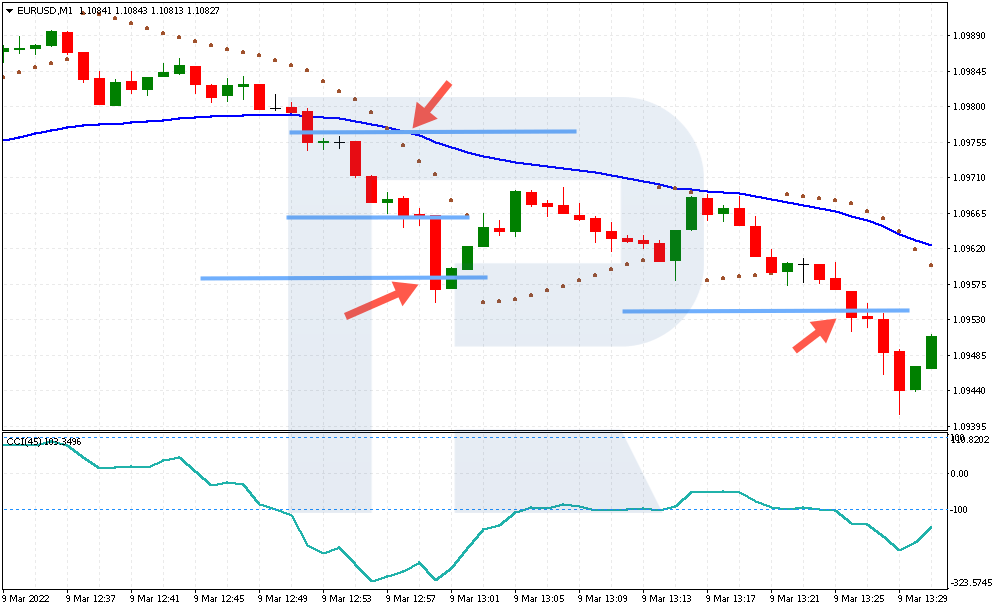
Here is the EUR/USD chart for 9 March 2022.
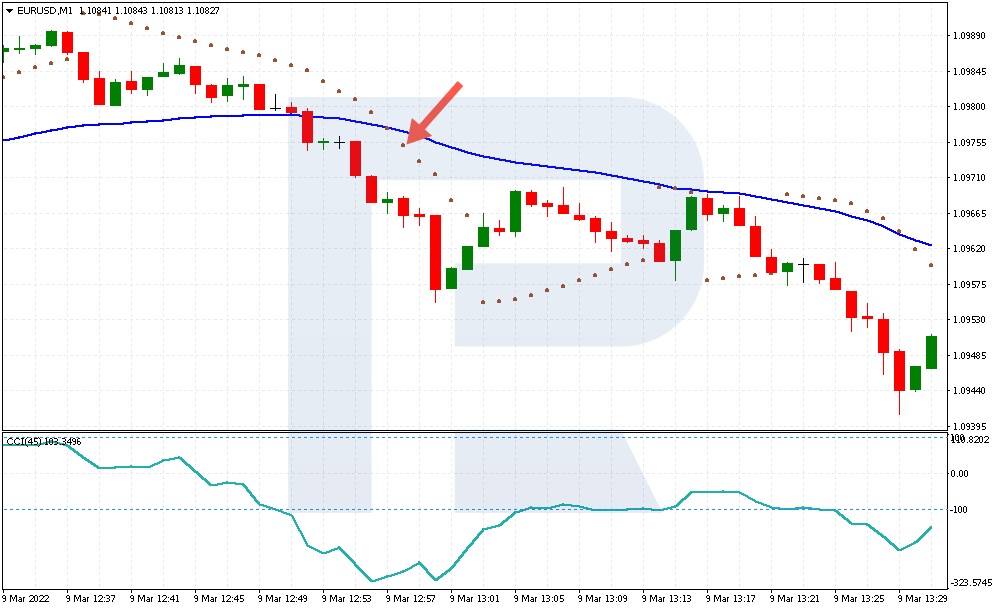
- After growing, the price starts to decline, and Parabolic SAR values break through the EMA line downwards. This is the first signal to open a selling trade.
- Check the CCI – the values are under -100. This is the second signal to sell. A trade can be opened at 1.0966.
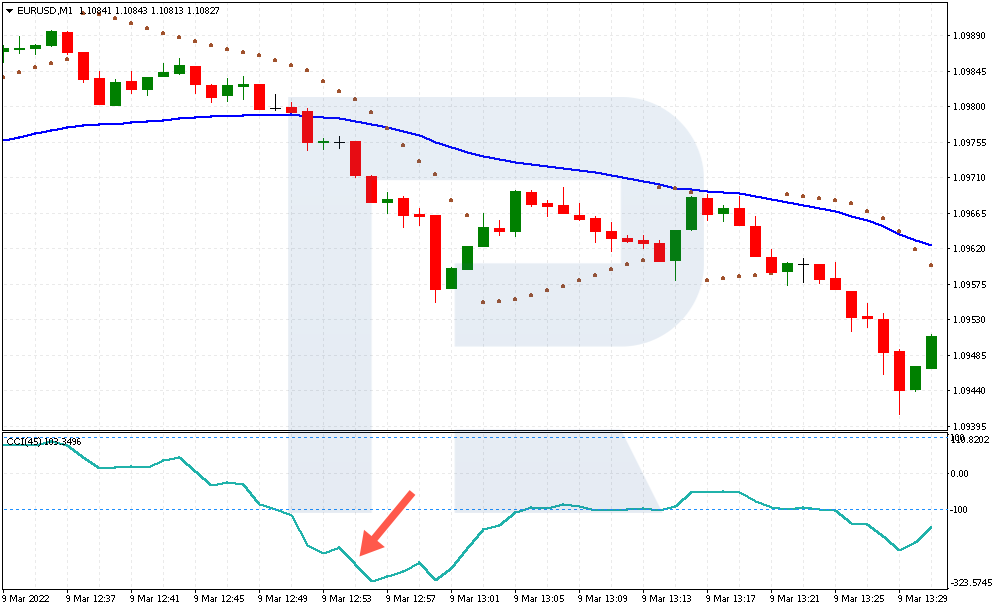
- Stop Loss is placed at 1.0976, where the EMA lies. The risk is 10 points.
- Then the price falls by 11 points, so the first TP sized 7 points would have closed very soon. The TP at 12 points would have taken longer. However, the price did reach it some time later.
Bottom line
The Scalping Parabolic SAR + CCI strategy is meant for trading on minute charts with minimum risks. The tactics use simple indicators, available on most standard platforms. Among the advantages, there are fast entries to the market and trading by the trend.
The scalping with Parabolic SAR + CCI strategy suits traders who want to trade actively with minimum risks, squeezing out whatever possible of the market. The disadvantage is the size of the Stop Loss, which is often higher than the potential profit. However, an experienced trader can just skip such trades and wait for a new signal to form – fortunately, they appear quite often.


