Trading with Forex Profit Boost Indicator

5 minutes for reading
In this review, we will get acquainted with a remarkable trend indicator Forex Profit Boost. On the price chart, it helps to find reversal points preceding a correction or a reversal of the current trend and the beginning of a new one.
Description of Forex Profit Boost
This indicator pertains to the group of trend indicators: it gives good signals when there is a pronounced trend beginning or acting in the market. In an extended flat, the signals might be preliminary; you may filter them by other indicators or the means of tech analysis.
Forex Profit Boost is a complex indicator based on two popular indicators: the Moving Average and Bollinger Bands. The two MAs with different periods (21 and 7 by default) set the direction of the current trend and give signals of a possible reversal. The Bollinger Bands represents the actual trend and the borders of the price range.
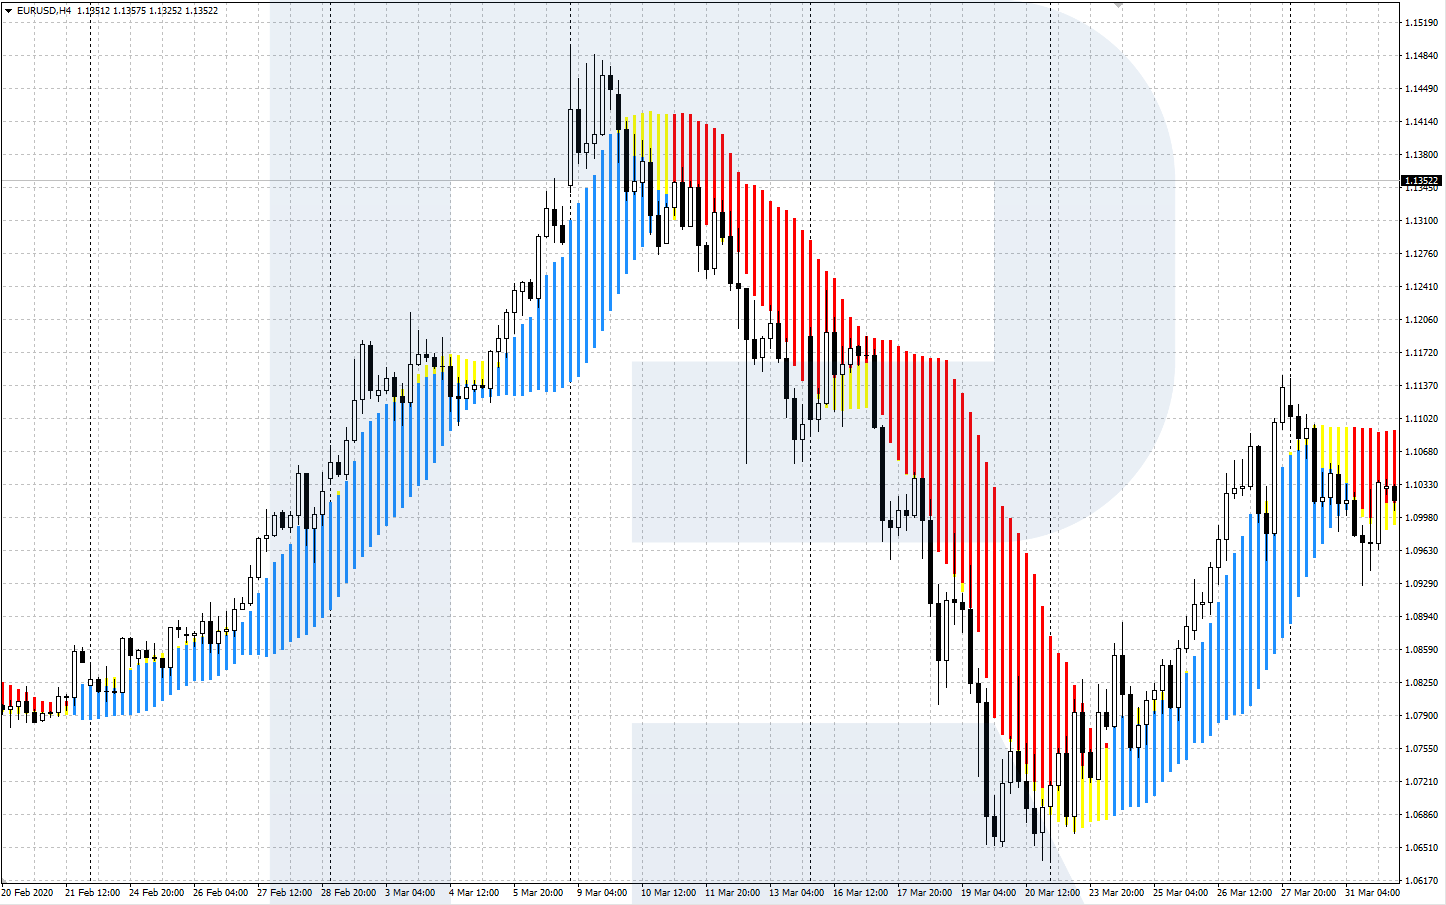
The indicator is drawn directly on the price chart of your financial instrument. It looks like a colored histogram based on the borders of the price channel of the Bollinger Bands and fast MA (7). The default colors are red, yellow, and blue, each corresponding to a certain type of trend
Colored histogram of the indicator signals
The declining bars in which the fast signal MA (7) is below the slow one (21) are colored red. The size of the bars indicates the distance from the upper border of the Bollinger Bands to the signal MA (7). A descending red histogram of the indicator means that the current trend is a downtrend, sales are recommended.
Blue bars of the histogram are ascending; the fast signal MA (7) goes above the slow one (21). The size of the bars indicates the distance from the lower border of the Bollinger Bands to the signal MA (7). A growing blue histogram indicates an uptrend, buys are recommended.
The yellow color means that the signal MA (7) has returned into the price channel of the Bollinger Bands. The size of the bars shows the distance from the crossed Bollinger Bands channel to the signal MA (7). A yellow histogram signals about ambiguity in the market, the beginning of a correction or reversal.
Installing and setting up Forex Profit Boost
This indicator is not standard: to start using it, download the file and install it in your trading terminal. Find a download link for MetaTrader 4 attached at the end of this article.
To install the indicator, copy the file into the folder "Indicators" in MetaTrader 4 via the Main Menu/File/Open data catalog/MQL4/Indicators. Restart the terminal.
As a result, Forex Profit Boost will appear on the list of user indicators. Install it via the Main Menu/Insert/Indicators/User/Forex Profit Boost. Or simply left-click it in the "Navigate" window and drag to the price chart.
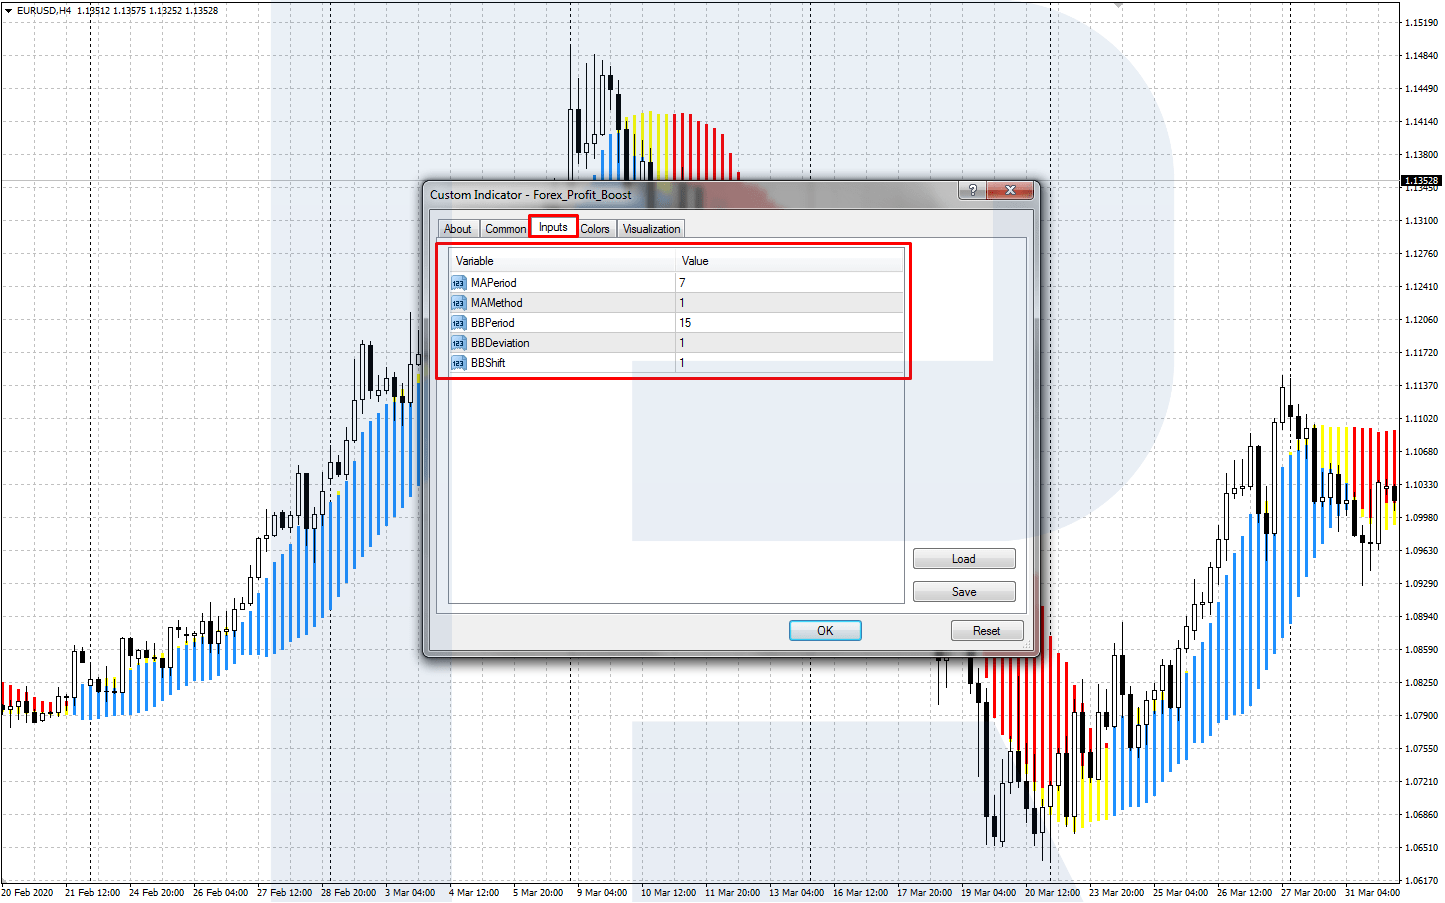
You may customize the following settings:
- MA_Period (7 by default) is the period of the fast signal MA.
- MA_Method (1 by default) is the averaging method of the fast MA, where:
0 is Simple
1 is Exponential
2 is Smoothed
3 is Linear Weighted
- BBPeriod (15 by default) is the period of the Bollinger Bands.
- BBDeviation (1 by default) is the standard deviation of the Bollinger Bands.
- BBShift (1 by default) is the shift of the Bollinger Bands.
The second, slow MA of the indicator is calculated as an SMA with period 21 and may not be changed.
Forex Profit Boost works well with the default settings. However, you may try to optimize it for your trading style.
The trading signals of Forex Profit Boost
The indicator gives two main trading signals: for an aggressive entry right at the change in the trend and a more conservative entry by the trend after a correction. An attempt to catch a reversal is riskier but may yield a good profit in the case of success. The conservative signal is more reliable as you enter after a correction by the actual trend.
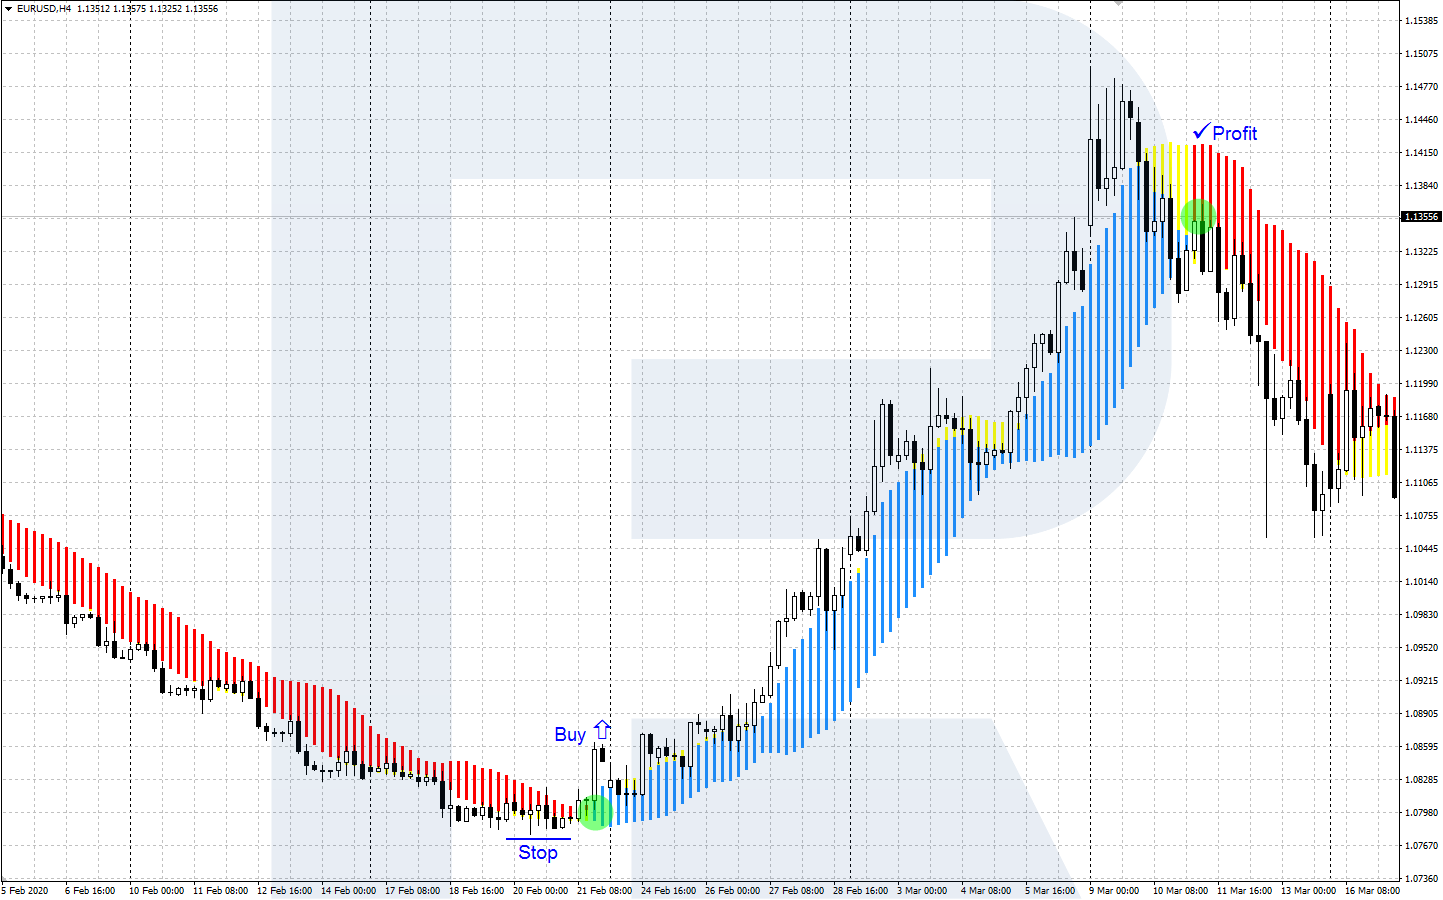
An aggressive signal: entering at the reversal
A signal to buy forms when a red histogram turns blue through yellow. After a growing blue bar appears, open a buying position with a Stop Loss behind the local low. Take Profit either when the price reaches an important resistance level or when a vice versa — red — histogram bar appears.
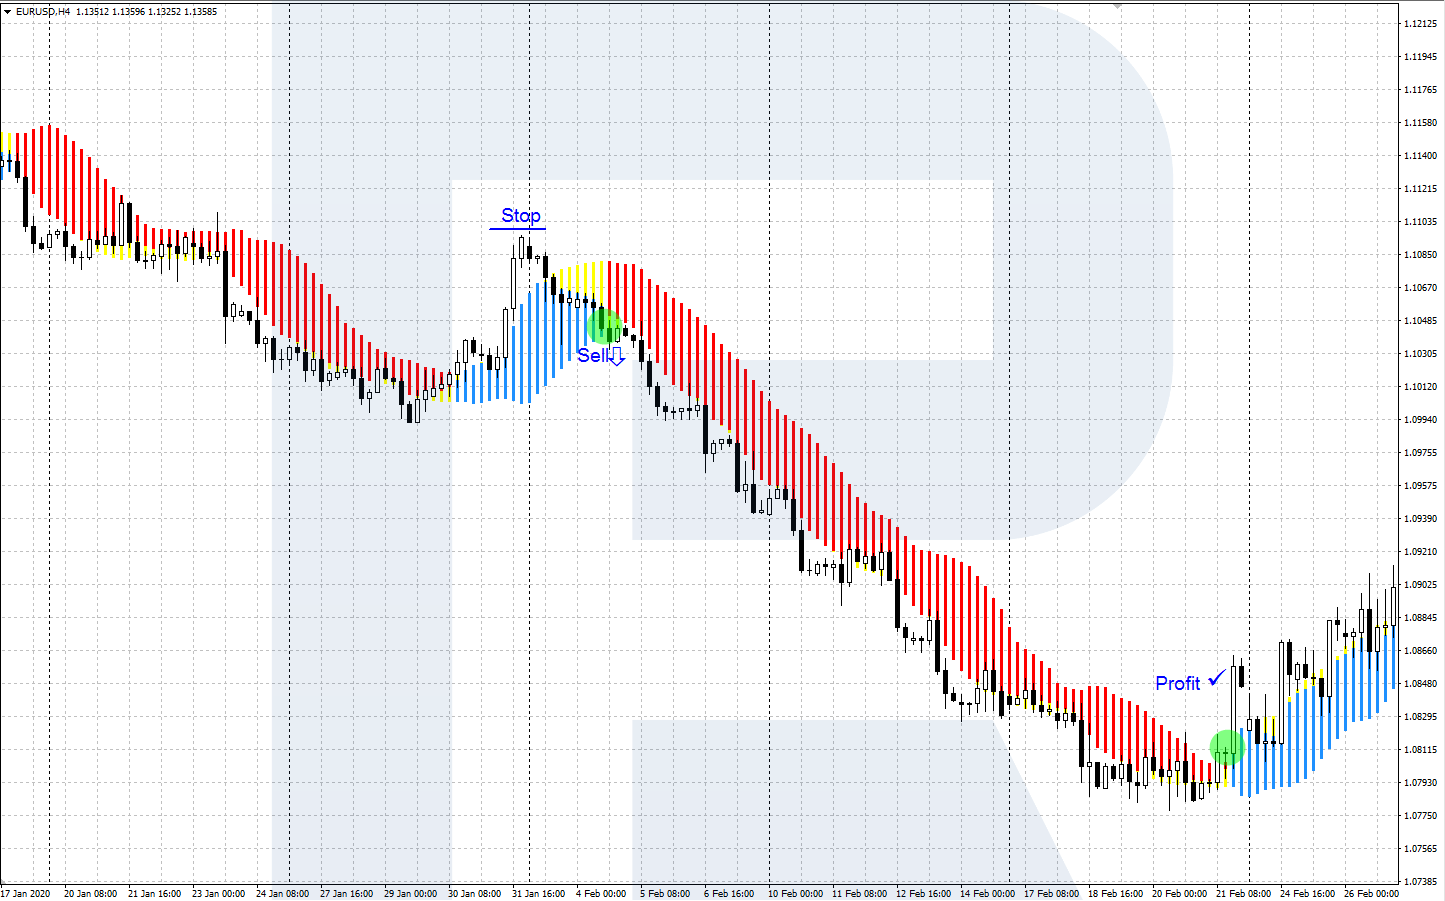
A signal to sell appears when the histogram turns red from blue through yellow. Open a selling position when a declining red bar appears; place an SL behind the local high. Take the profit at a strong support level or the change of the histogram for blue.
A conservative signal: entering after a correction
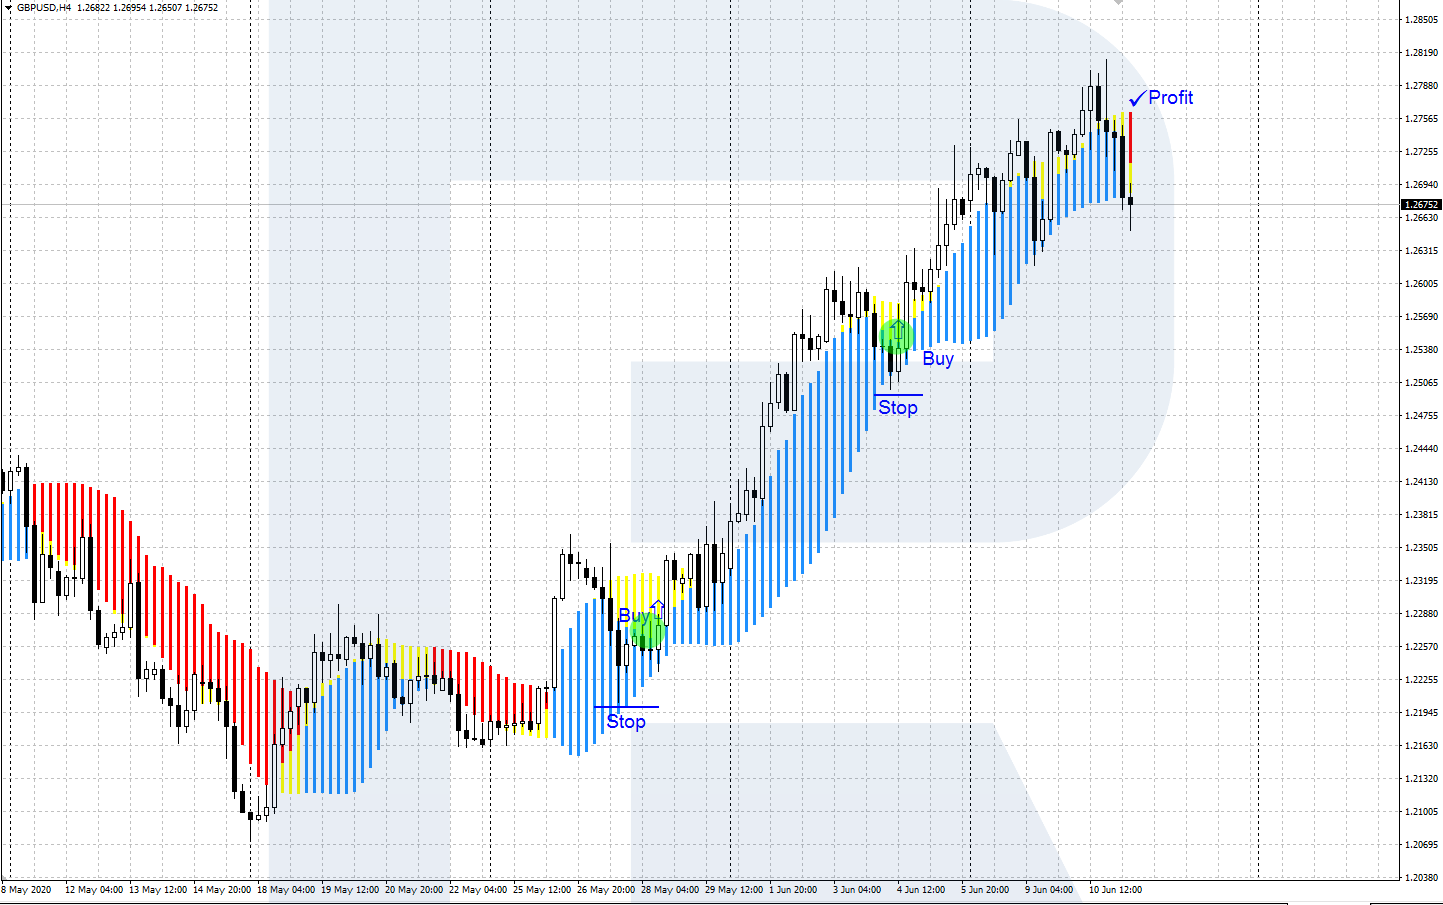
A signal to buy emerges in an uptrend when the histogram is blue and growing. Wait for declining yellow bars meaning a correction. When the yellow bars form a local low and reverse upwards (however, no red bars emerge), open a buying trade with an SL behind the nearest low on the price chart.
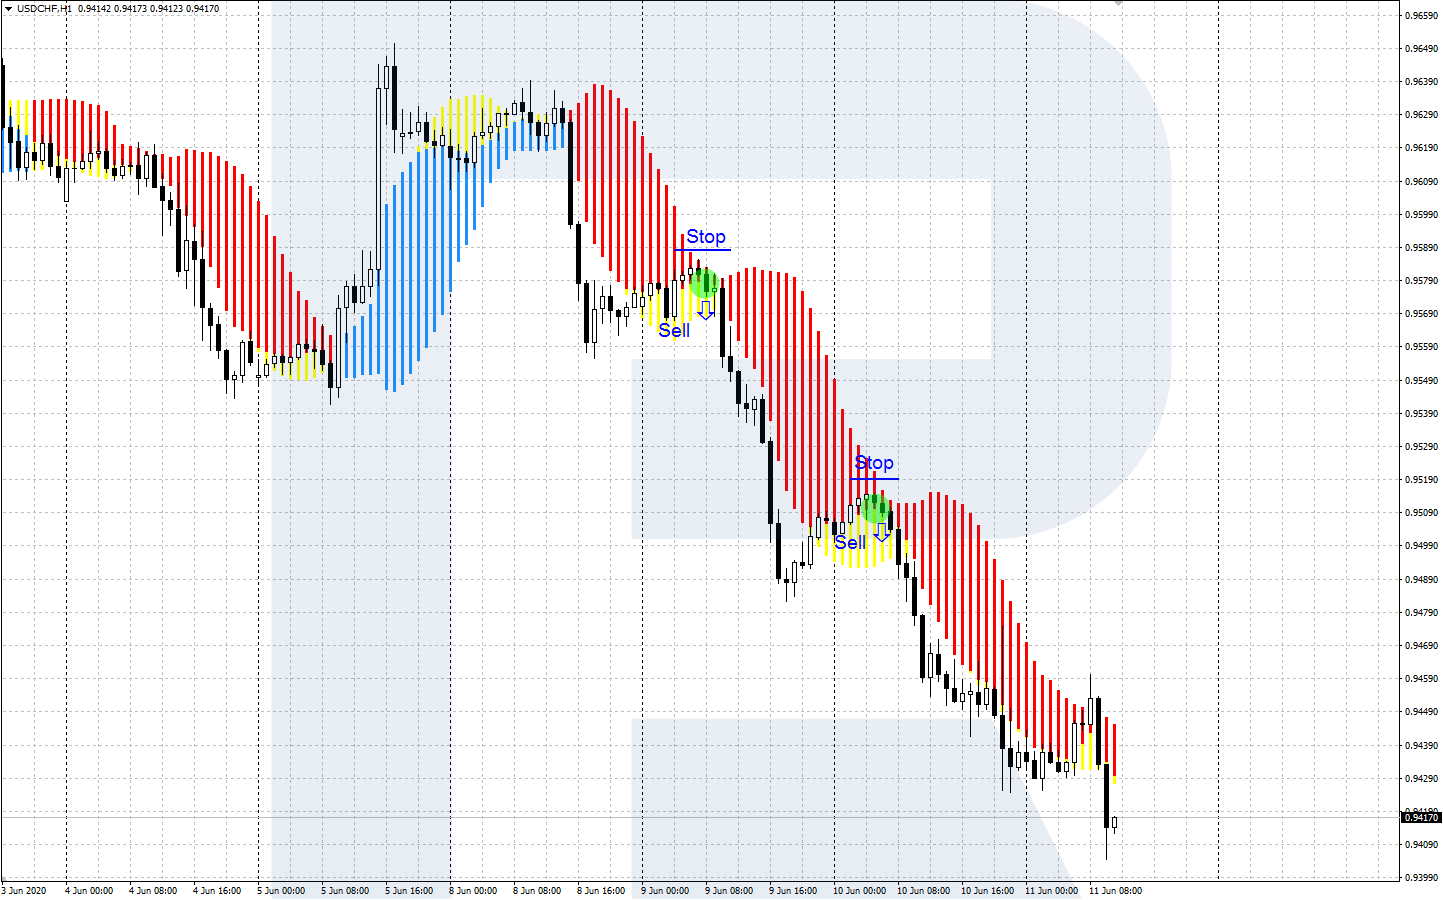
A signal to sell emerges in a downtrend when the red histogram is declining. Wait for a correction, i.e. growing yellow bars of the histogram. When the correction is over and the yellow bars, having formed a local high, reverse downwards (but no blue bars appear), enter a selling trade. Place an SL behind the local price high.
Bottom line
Forex Profit Boost is a good and demonstrative trend indicator. However, regardless of its complexity and the use of two popular indicators (the MA and Bollinger Bands), Forex Profit Boost may hardly be called an independent trading system.
As well as other trend indicators, Forex Profit Boost may give false signals in a lengthy flat. To enhance the quality of signals, try using other indicators, tech analysis, or Price Action patterns.