Heiken Ashi + ADX + Stochastic Trading Strategy

6 minutes for reading
Today, we will speak about another trading strategy meant for minute charts, with a potential profit of 10-15 points per trade. The characteristic feature of this strategy is the use of the ADX indicator on small timeframes: normally, it is used on daily charts, as its author advised. However, here, instead of normal Japanese candlesticks, we use Heiken Ashi, which is, again, rather unusual for a simple trading strategy.
What indicators do we need?
To set up the strategy for decent work, we only need three indicators.
Heiken Ashi
First and foremost, install the Heiken Ashi indicator. Many traders say it demonstrates current market trades immaculately. This is traditionally a user indicator, not included in most trading terminals. When you add the indicator to the chart, candlesticks turn red and green.
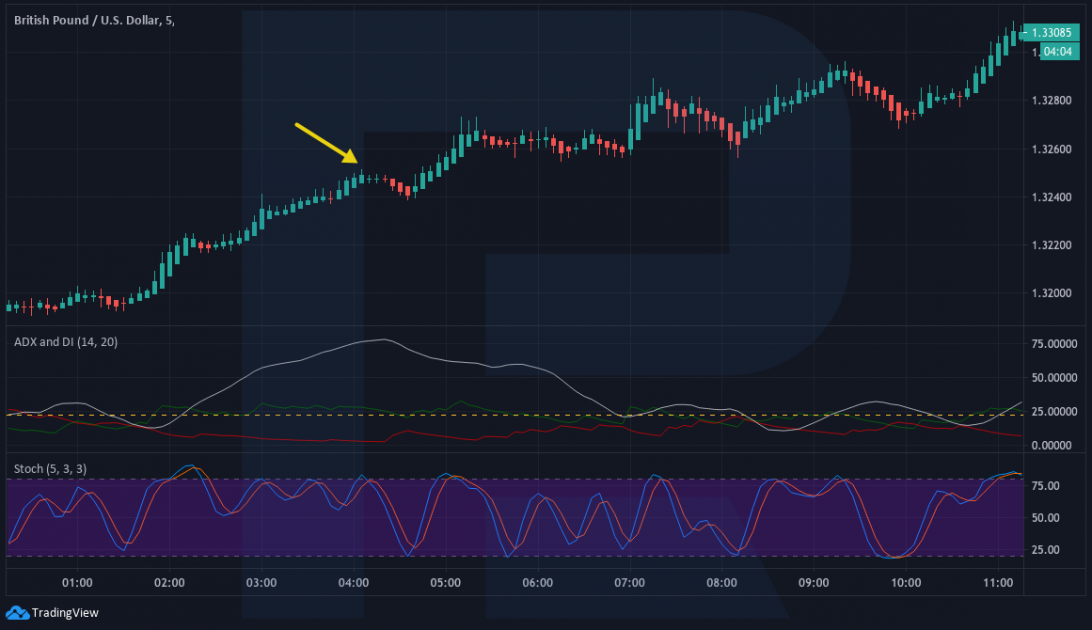
Red candlesticks mean a downtrend, and many traders recommend selling on such candlesticks only. Conversely, when the indicator turns green, look for buys. In the simplest strategies, traders add the Stochastic Oscillator to confirm the signals of Heiken Ashi.
ADX
The second indicator we will need is ADX, or Average Directional Moving index, which also shows the current market trend. According to the author, if ADX values grow, this indicates a strong trend, while low values signal bout a flat.
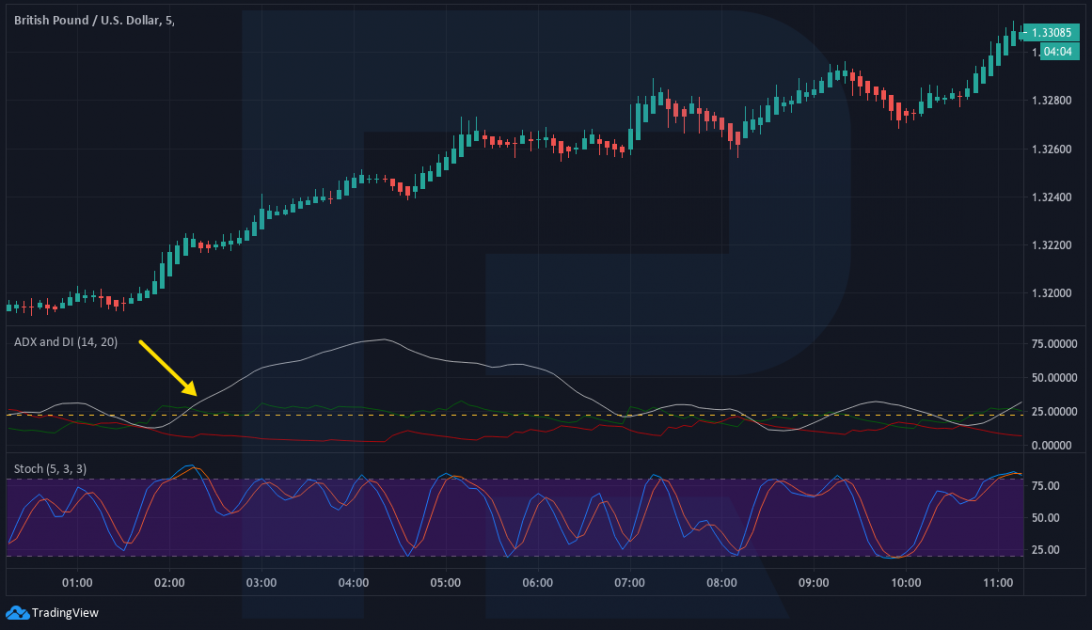
Be careful: when the indicator values grow, this just means there is a trend in the market but we do not know whether it is bullish or bearish.
Stochastic Oscillator
The third indicator is the Stochastic Oscillator with the parameters (5, 3, 3) that in many strategies, gives good entry signal by the crossing of its signal lines. Being an oscillator, this indicator shows how far the price has fluctuated from its average values.
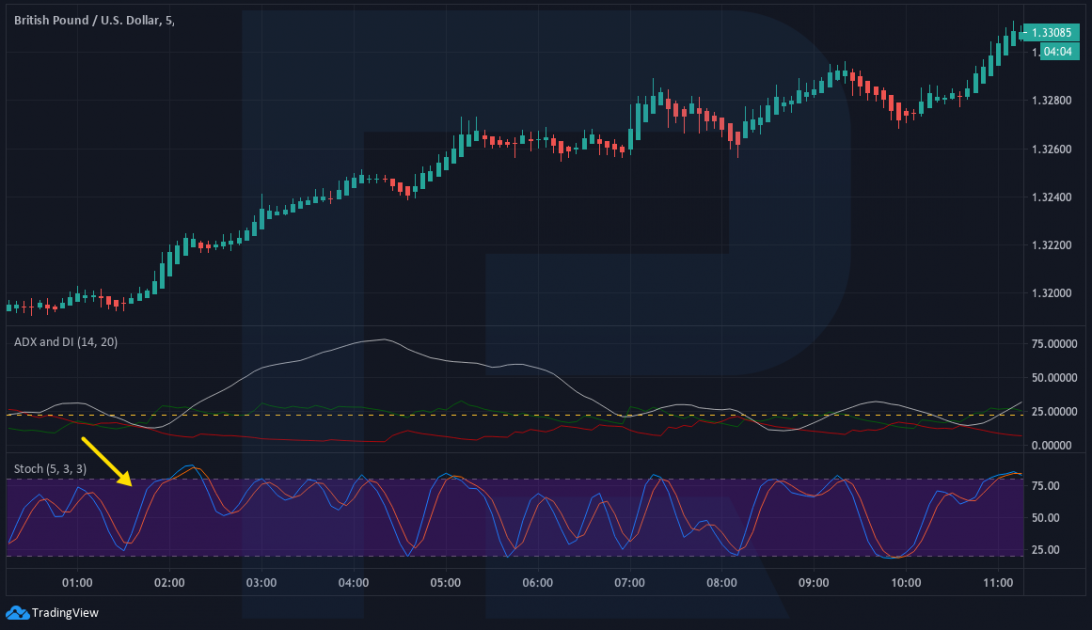
If the trend is bullish, and the indicator values are low, we may expect growth. In most cases, the Stochastic shows the end of a correction well. In our strategy, it will confirm market entry.
Opening a buying trade
To open long positions, make sure to comply with several requirements. Of course, we need the trend to be ascending; as long as we are working on M5, we better say not the trend but impulse. So, to open a buying trend, you will need:
1. The price is above the middle line of Heiken Ashi, and on the chart, there are two ascending candlesticks one after the other – this indicates an uptrend.
2. The ADX main line is above 22, which means there is a trend on the chart. In our case, we see that the trend is ascending because the +D line is above the -D line.
3. The Stochastic Oscillator values are going up; note that we do not care about whether the signal lines cross, we only need the direction.
As soon as all the requirements are fulfilled on M5, you may open a buying trade. If just one condition is not met, stay away from the market and wait for a new signal.
An example of buying by Heiken Ashi+ADX+Stochastic
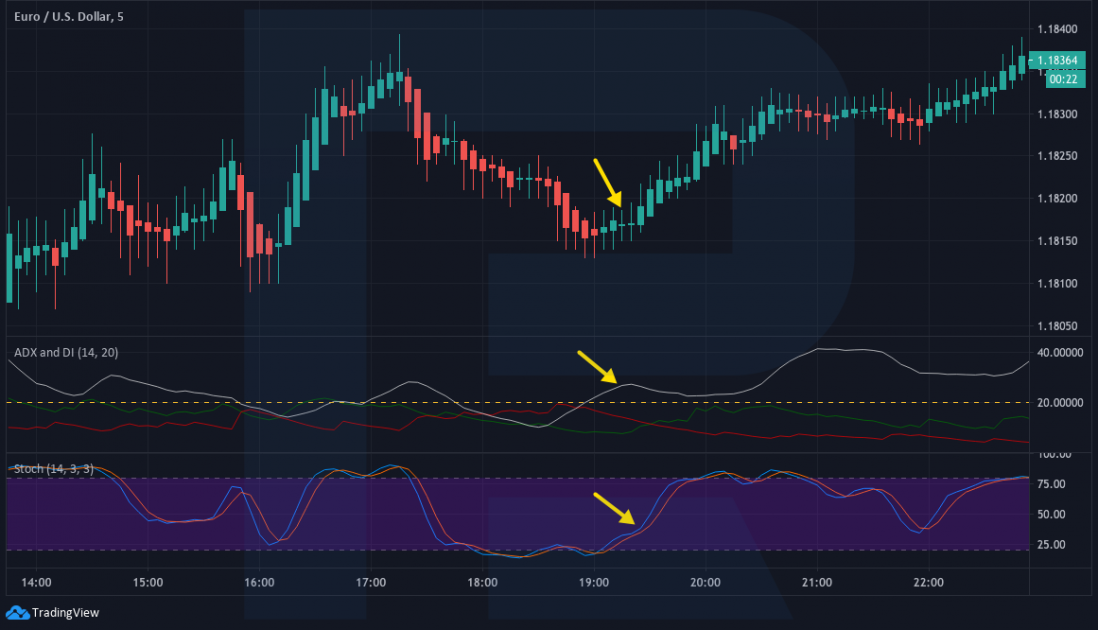
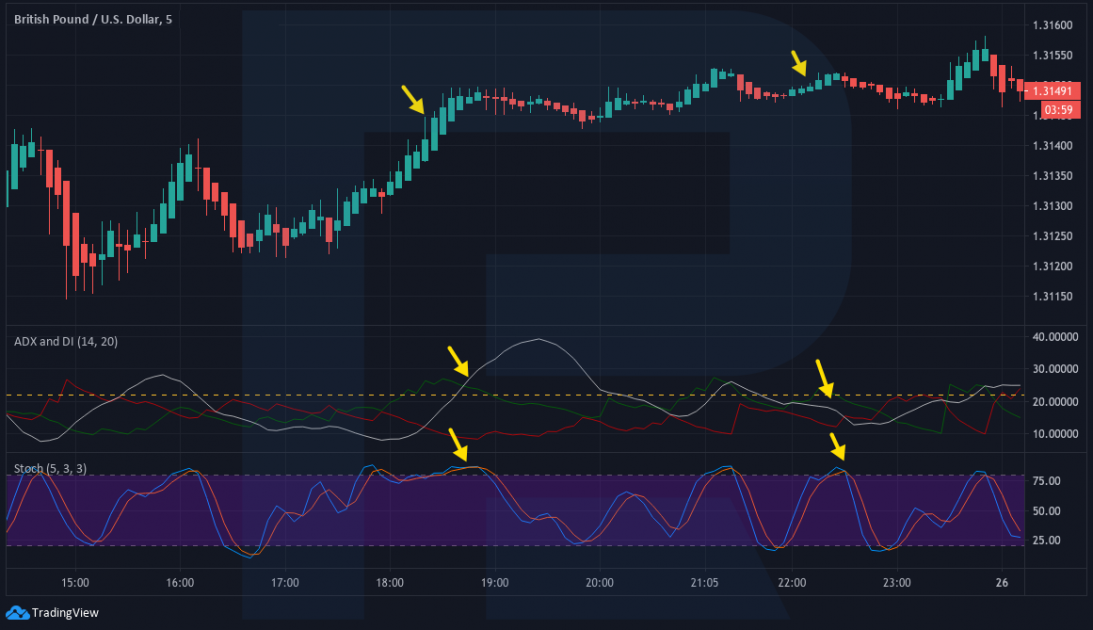
Let us have a look at a buying trade with EURUSD. There was a downtrend, the candlesticks of Heiken Ashi were red. We wait for the moment when two green candlesticks emerge one after another because this will mean a reversal of the trend. Check the ADX values: the line is above 22, which again indicates a trend. The Stochastic values are growing, so we can buy on the next candlestick by our strategy because all the requirements are fulfilled.
Why is it important to meet all the conditions?
The importance of the rules becomes clear in the following example: imagine that the Heiken Ashi candlesticks are green but the ADX line is below 22, while the Stochastic values are above 80, moving horizontally. In such a case, stay away from the market. Situations like this happen, the price may even grow in such conditions but the rules of the strategy tell us to abstain from entering the market.
Opening a selling trade
To open short positions, we also need to comply with certain conditions. Here, we are looking for a downtrend. So, the conditions for opening a selling trade are as follows:
1. The price is below the middle Heiken Ashi line, while on the chart, two descending candlesticks formed one after the other. This indicates an actual bearish impulse.
2. The main ADX line is below 22, indicating a downtrend on the chart. In our case, we understand that the trend is bearish because -D is above +D.
3. The Stochastic values are going down. Again, we are not interested in the crossing of the lines, just the direction.
As soon as all the requirements are fulfilled on M5, you may open a selling trade. If just one condition is not met, stay away from the market and wait for a new signal for a buying or selling trade depending on the situation.
An example of selling by Heiken Ashi+ADX+Stochastic
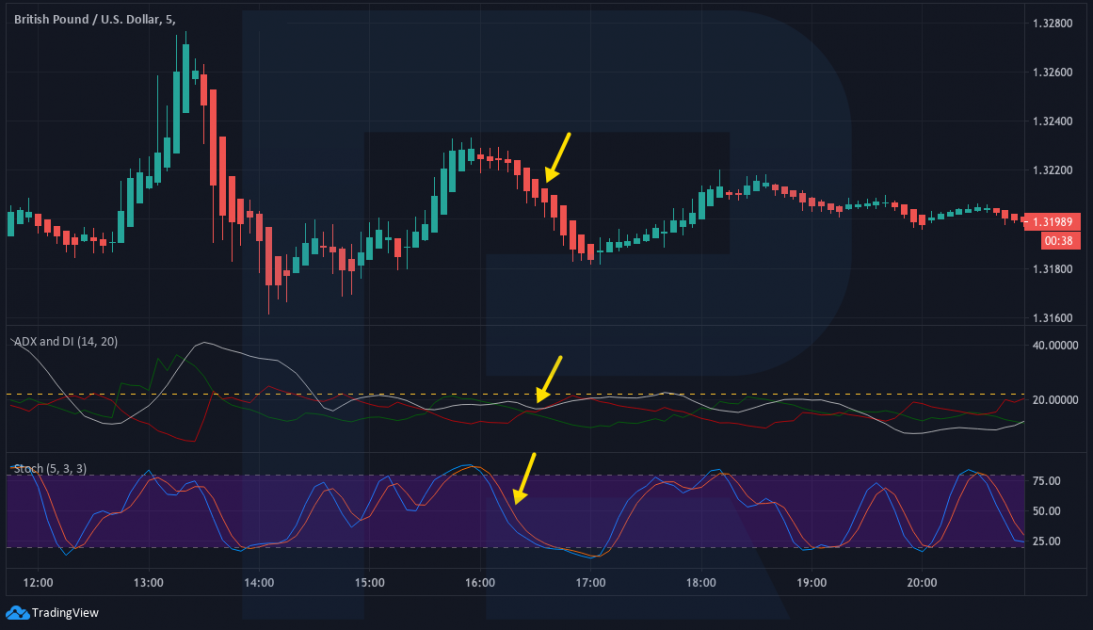
Have a look at an example with the GBPUSD pair. The Heiken Ashi candlesticks are red, there have been more than two of them in a row. The ADX values are below 22 but -D and +D cross only later. The Stochastic values are also going down, and we may sell right after a downtrend forms on the ADX.
When should I close the trade?
The conditions of exiting the position are rather simple. For a Take Profit, 10-15 points will be enough: remember that we are working on M5, so such a T{P will suffice. Limit the Stop Loss by 10-15 points. In most cases, if you have done everything right, the price reaches those 10-15 points of profit easily; if the market reverses, exit without hesitation. Anyway, this loss to profit ratio is quite working.
Closing thoughts
We have discussed quite a simple strategy for trading on M5 – the Heiken Ashi+ADX+Stochastic strategy. The method features three completely different indicators, and it is extremely important to follow the trend.
ADX might seem misplaced here as it is meant for daily charts; however, the examples above show that the strategy gives decent signals. Also, note that your potential profit is higher than the potential loss, which gives you an advantage in the long run and helps to follow simple money management rules.


