How to Trade Renko Charts: Main Strategies

7 minutes for reading
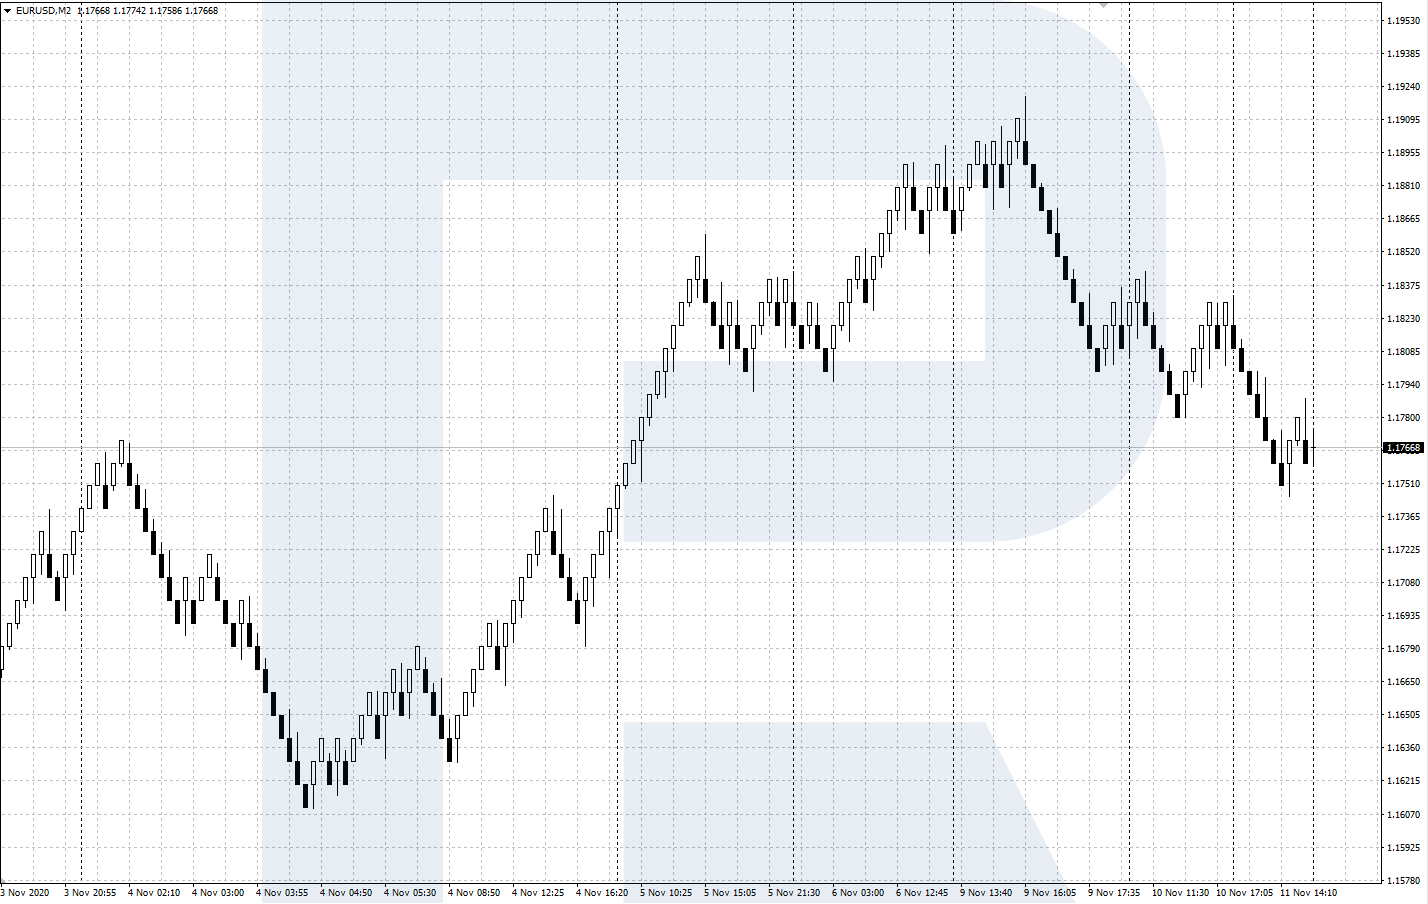
In this article, we will discuss a strategy using the Renko charts. This is a specific way of representing the price chart that highlights the size of the movement, regardless of time.
This topic was suggested to us by one of our regular readers through the feedback form, so we will try to disclose the information on trading the Renko charts as much as possible.
What is a Renko chart?
Renko candlestick charts are coming from Japan, where they first appeared and were called "renga", which means "a brick". Such candlesticks look like small rectangle boxes/bricks composing the price chart.
Renko charts represent price movements directly, help to filter market noises, detect the current trend, and find important support and resistance levels.
Renko candlesticks are rectangles of the same size, linking highs and lows of the price when it changes for a certain number of points. If the alteration of the price is smaller, a new candlestick does not emerge at all.
Renko candlesticks are not bound to timeframes, they are focused on price changes solely. When the market is active, there are more Renko candlesticks on the chart; when the quotations are in a flat, and volatility drops, there are less of them.
A new candlestick appears only when the price exceeds a set threshold. For example, if the set size of a Renko candlestick is 10 standard points, and the price has grown by 20, there will appear 2 white "bricks", 10 points each.
If the price is falling, the candlesticks on the chart turn black, each of them also reflects a decrease of 10 points. Thus, a Renko chart shows the general direction of the price movement, smoothing out minor fluctuations.
The advantages and drawbacks of Renko charts
Renko chart was created for making the main market trend easier to perceive. As well as other methods of price representation, Renko candlesticks have their advantages and drawbacks.
The advantages would be:
- A clear averaged representation of the trend;
- Filtering of meaningless noises on the chart;
- Smoother work of indicators and advisors;
- The chart shows the places of probable trend reversals;
- The chart represents key support and resistance levels.
The drawbacks of the method would be:
- Short lagging in the forming of the chart as it waits for another "brick" to be complete;
- It is more difficult to detect current volatility and consolidation areas;
- The chart does not account for volumes.
Installing and setting up Renko chart in MT4
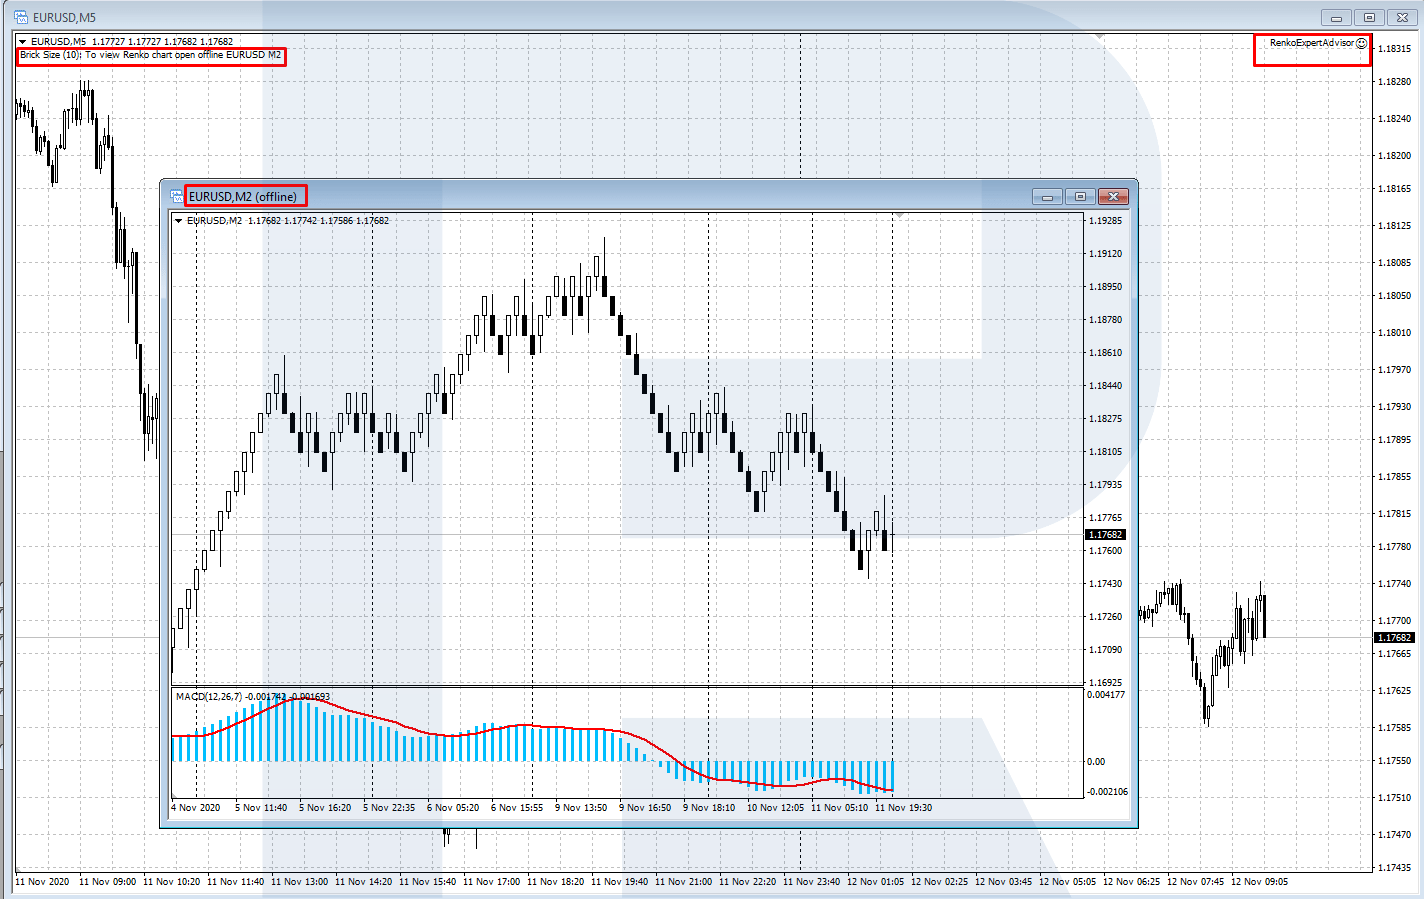
To install the Renko charts to MT 4 trading terminal, first of all, download the files of a special expert advisor RenkoExpertAdvisor via a link at the end of this article. Copy the files to the folder Experts.
In the Main Menu, open File/Open Data Catalog/MQL 4/Experts. Copy the files of the EA into the folder, then restart the terminal.
As a result, RenkoExpertAdvisor will appear in the Navigate window. To add it to the chart of the chosen instrument, left-click and drag it to the necessary window. Then choose Service on the instrument board, click Settings, then proceed to Expert Advisors. Tick Automatic Trade and Import DLL.
After you drag the EA to the desired chart, open the window with settings:
- Brick Size is the size of a Renko candlestick in points; 10 points by default;
- Brick Offset sets the shift of the chart; 0 by default;
- Renko TimeFrame is the timeframe of the Renko chart; 2 by default;
- Show Wicks: if "true", the shadows of candlesticks are visible;
- Emulate OnLineChart switches on (if "true") constant renewal of the Renko chart.
After choosing the settings, in the upper right corner of the chart, you will see a smiling face and the name RenkoExpertAdvisor. Moreover, in the upper left corner, you will see a text, telling you to open a new Renko chart in the autonomous regime. To do it, choose File/Open Autonomously.
You will see a window with a list of autonomous charts. Choose a chart with the parameters specified in the upper left corner of the window with the expert advisor. Open it with a double left click of the mouse. A window will appear with a Renko chart that will be constantly renewed. Now you can add indicators to Renko charts and start trading.
Trading strategies with Renko charts
There are plenty of various strategies to use with Renko charts. Let us discuss trading tech analysis patterns and divergences with the MACD.
Renko charts trading: tech analysis patterns
The Renko chart smoothes out price movements and eliminates minor fluctuations. Thus you can detect various price patterns and support/resistance levels more precisely. Trade price patterns by the classical rules of tech analysis.
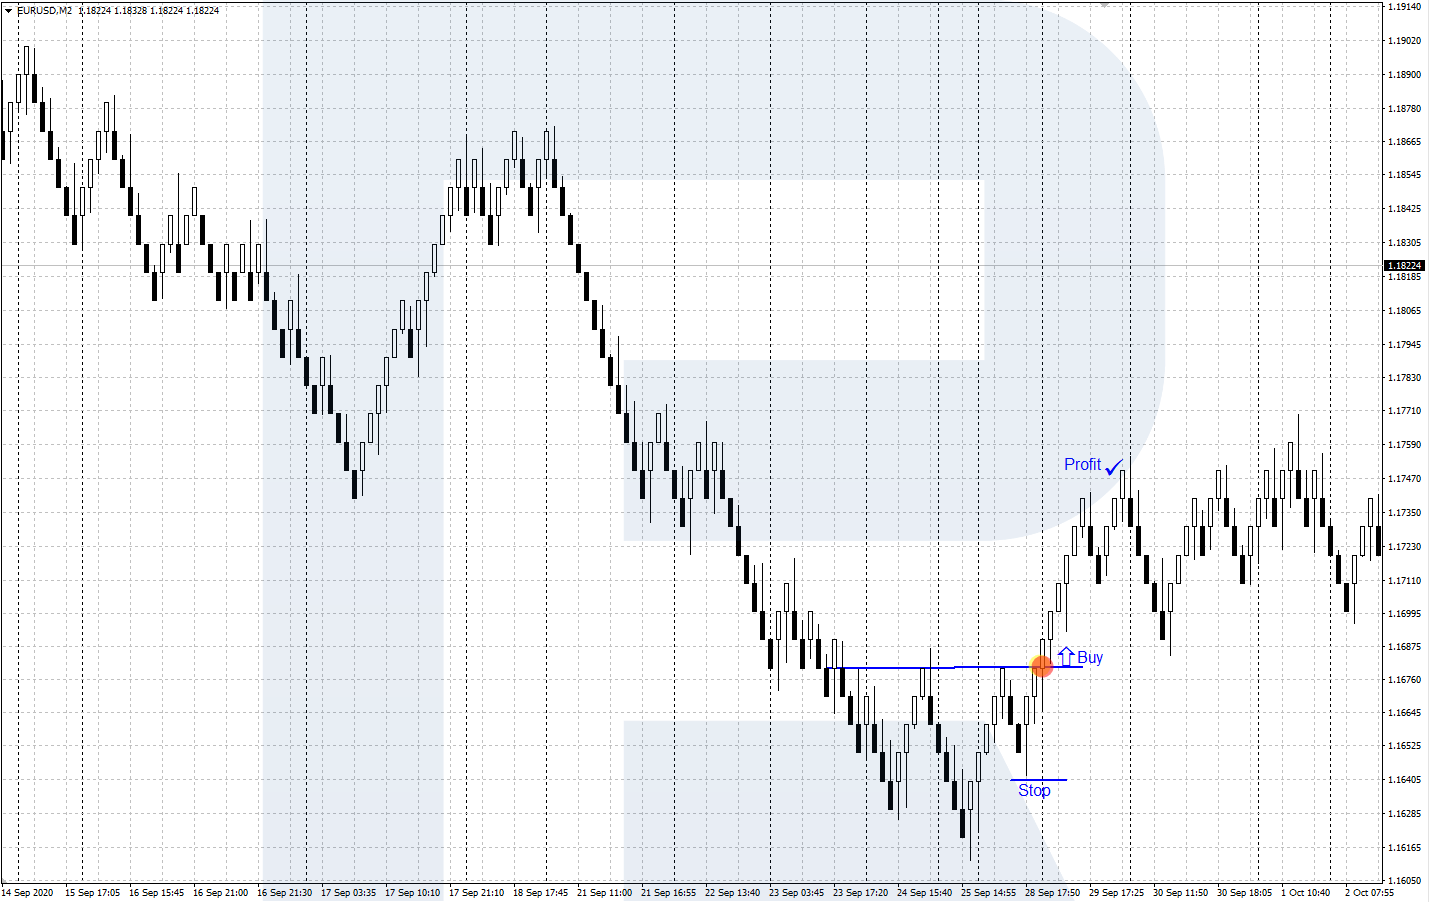
Example 1
On the EUR/USD forex chart, in a downtrend, an inverted Head and Shoulders pattern formed. After the price breaks away from the baseline of the pattern, open a buying position. Place a Stop Loss behind the nearest Shoulder and take the profit at the height of the pattern.
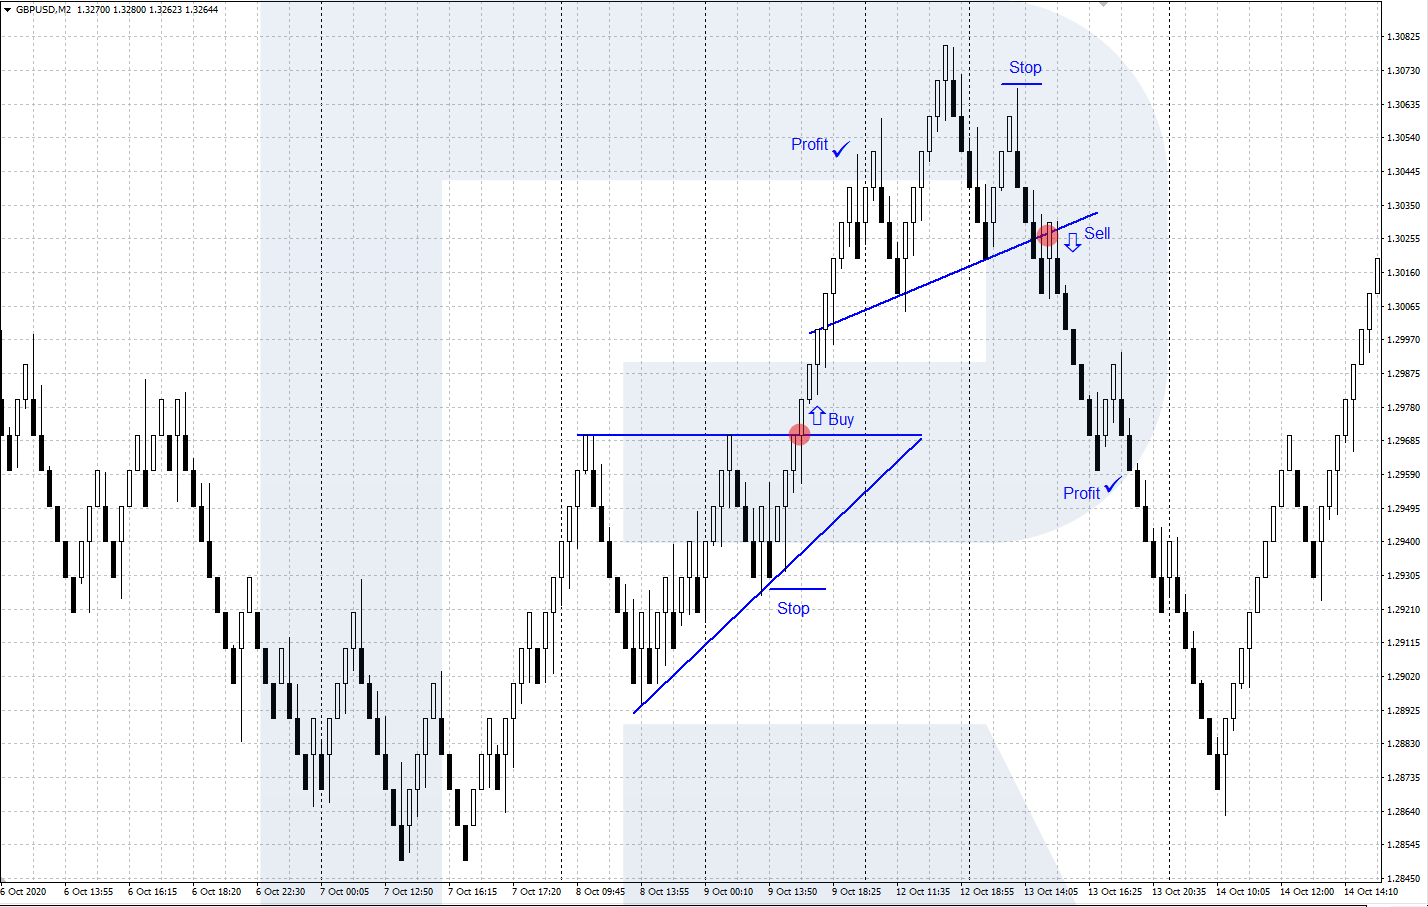
Example 2
On the GBP/USD forex chart first formed a trend continuation pattern Ascending Triangle, which gave a signal to buy. Then, after the ascending impulse ended, a reversal Head and Shoulders pattern formed, giving a signal to sell.
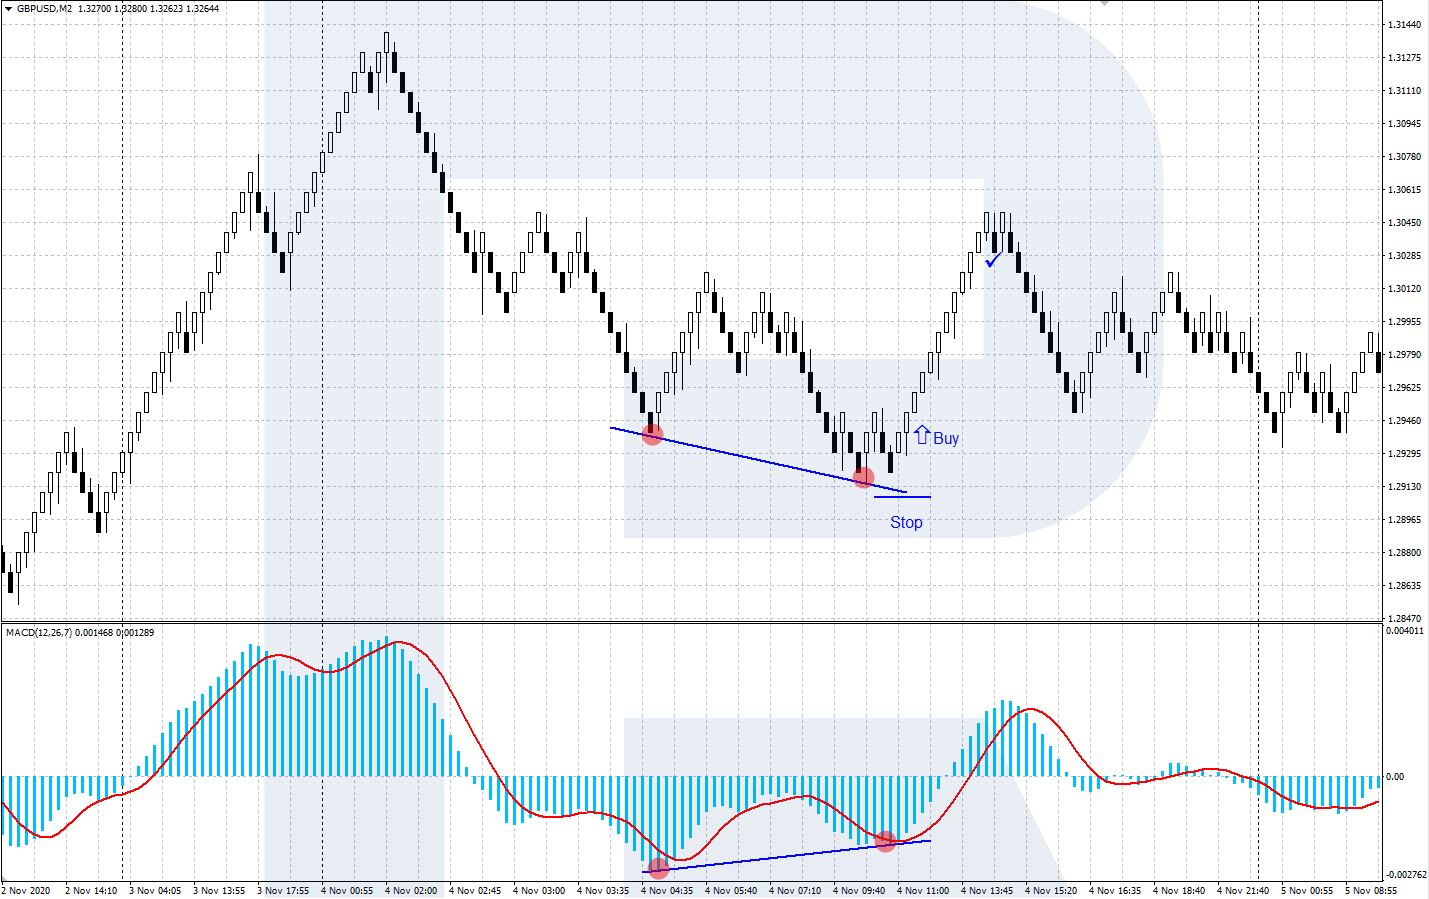
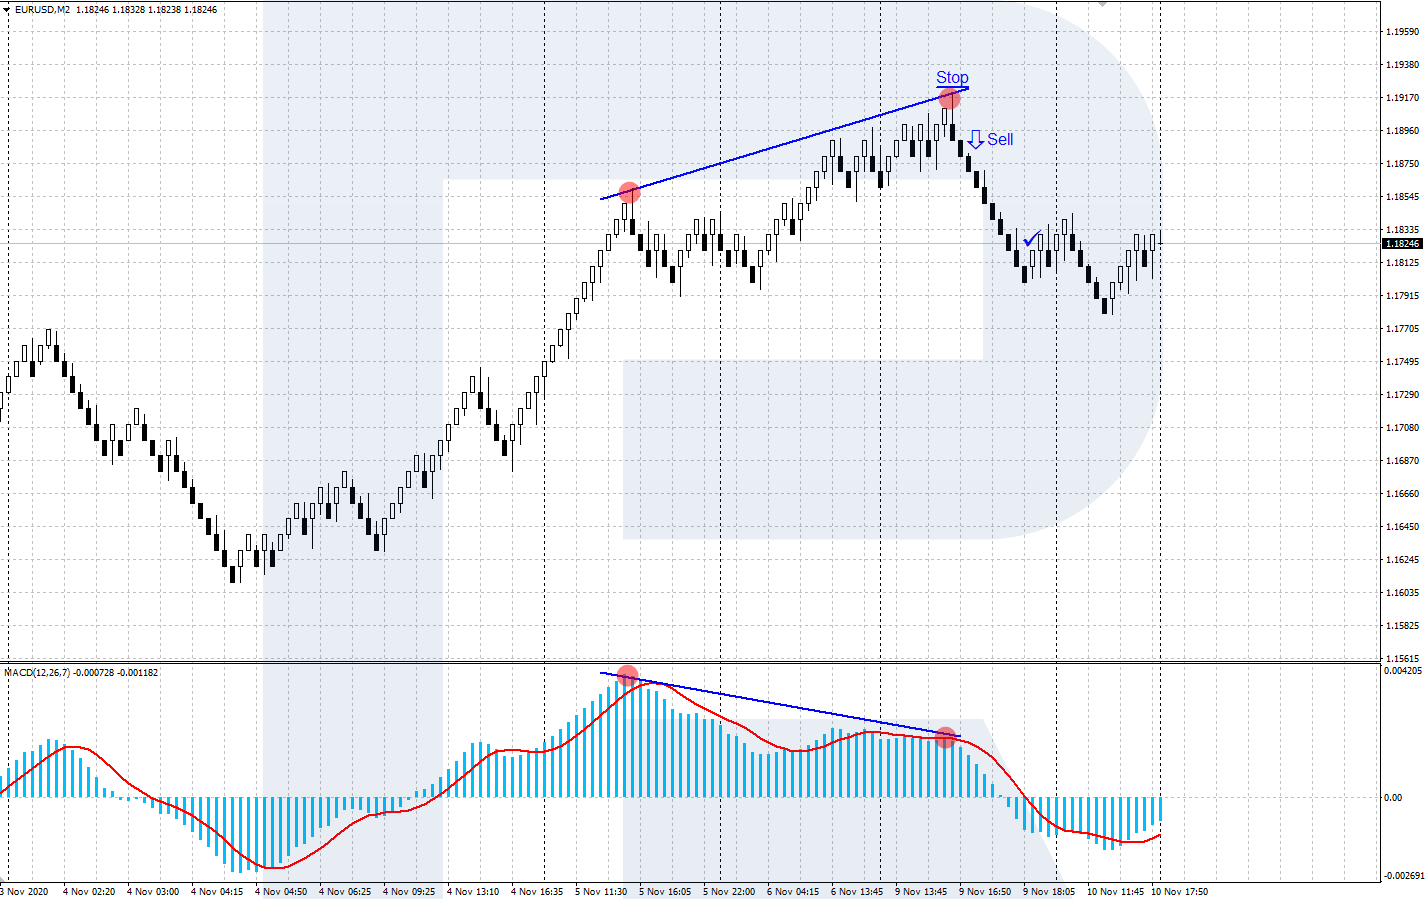
Trading divergence of the Renko with the MACD
For trading, we can use the divergence of the Renko chart and the MACD. A buying divergence forms when the chart shows a low under the previous one, while the low of the MACD histogram turns out above the previous low. As for selling, it goes vice versa: the Renko chart shows a high above the previous one, while the high of the MACD turns out lower than the previous one.
Example 1
On the chart of GBP/USD, a bullish divergence formed. Open a buying position with the SL behind the local low of the chart. Take the Profit when evidence of an upcoming reversal appears.
Example 2
On a chart of EUR/USD, there has formed a bearish divergence. Open a selling position with a Stop Loss behind the local high of the chart. Take Profit - when some evidence of an upcoming reversal upwards appears.
Closing thoughts
The Renko chart is an original way of representing changes of quotations on the price chart, with a highlight on detecting the main trend. A trader can use it for detecting the trend, filtering market noise, and finding important support and resistance levels. Check your trading tactics on a Renko chart: it may help you achieve better results.


