VSA Method: How to Trade Volumes

6 minutes for reading
Warning: Invalid argument supplied for foreach() in /web/blogs/sites/blog.roboforex.com/wp-content/plugins/wp_glossary/includes/class-wpg-linkify.php on line 353
Warning: Invalid argument supplied for foreach() in /web/blogs/sites/blog.roboforex.com/wp-content/plugins/wp_glossary/includes/class-wpg-linkify.php on line 353
The VSA Method was designed in the 20th century by a successful stock market player Tom Williams. Initially, Williams wanted to study a trading strategy called the Wycoff Method. However, later he got to know market mechanisms and the very methods so well that he improved the strategy and called it the VSA Method.
In essence, this is a simplified Wycoff Method based on volumes, closing prices of bars, and spreads (in this case, under spread we mean the difference between the high and low of the bar).
How does the method work?
VSA stands for Volume Spread Analysis. Theoretically, the market is always on one of the following stages:
- Accumulation is a sideways movement, during which large market participants accumulate positions.
- Decline/growth is the development of an up- or downtrend.
- Distribution is a sideways movement, in which major players close their positions selling the asset to smaller traders.
At the accumulation stage, the market situation is like a spring being compressed. The asset is accumulating volume for an upcoming movement. The price is in a flat that can last quite long. Major market players accumulate positions expecting a price impulse. The longer this stage takes, the wider the price will swing.
Decline/growth is the stage at which the spring is released. The quotations form a clear trend and reach their highs or lows on the visible part of the chart.
At the distribution stage, traders close their positions opened at the accumulation stage and take the profit. This stage can become another accumulation phase, and the cycle will repeat itself.
Timeframes for the VSA Method
To analyze the market situation, timeframes from M5 to H4 are used. On D1 and above, this method becomes erratic. On smaller TFs, it is unstable, giving lots of false signals.
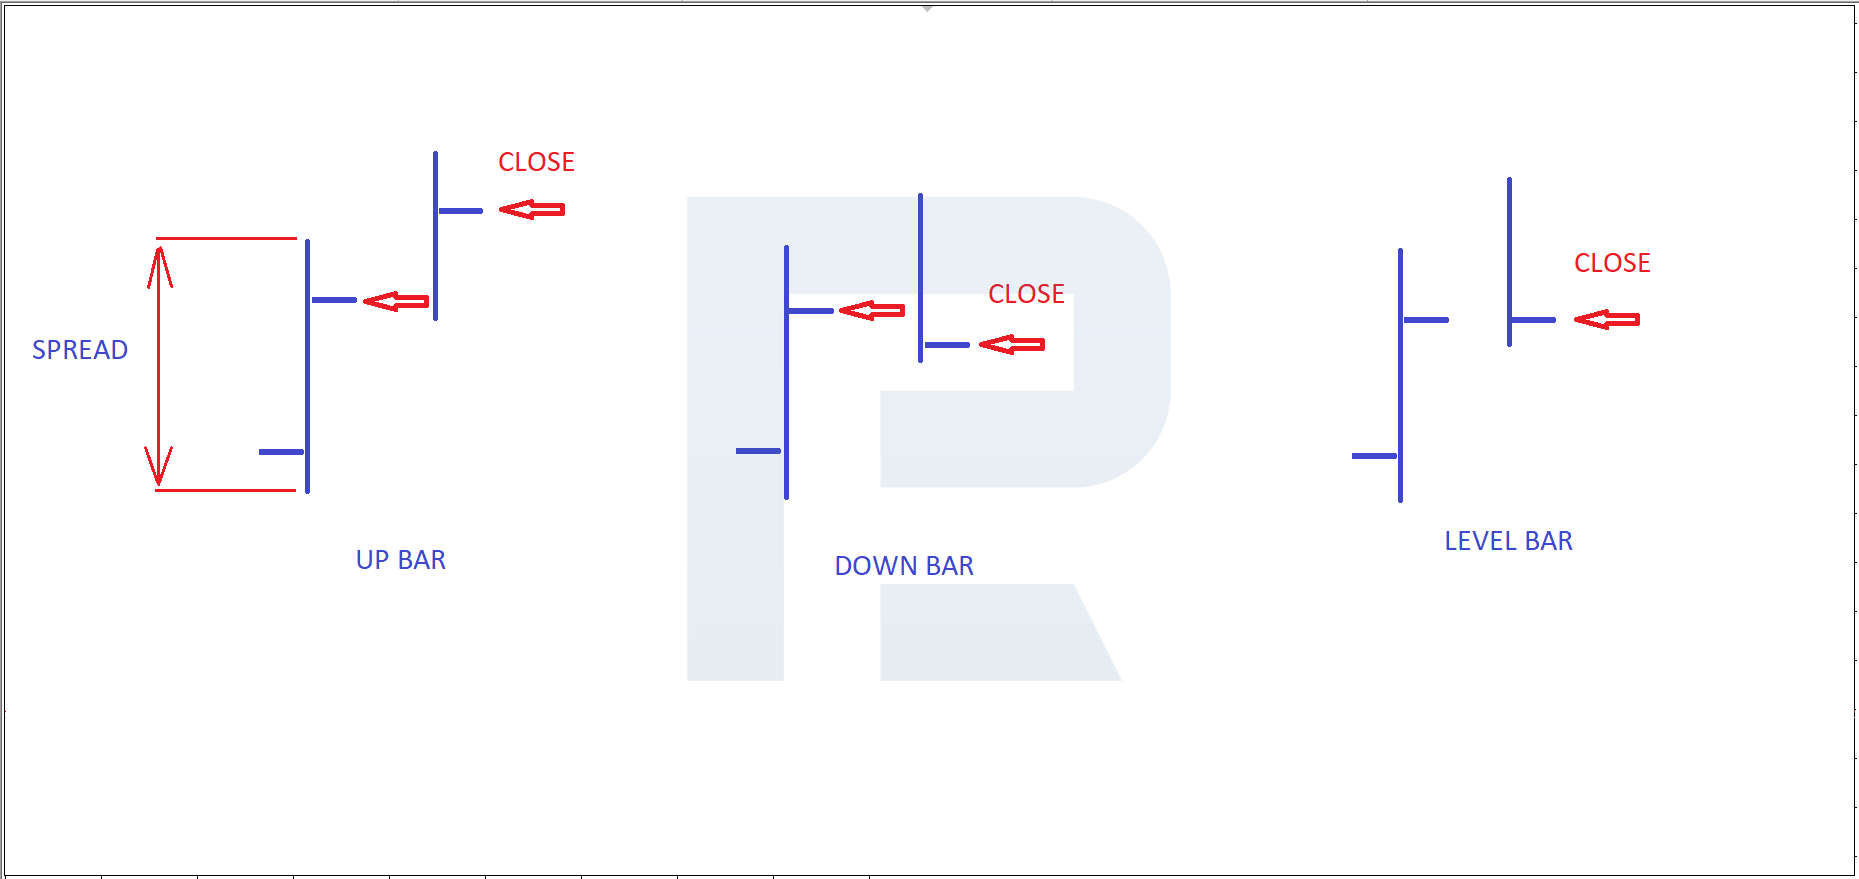
Main patterns of the VSA Method
- Up Bar: the closing price of the next bar is above the closing price of the previous one.
- Down Bar: the closing price of a bar is below the closing price of the previous one.
- Level Bar: two closing prices are at the same level.
The idea of the method
The method is based on the idea that the market situation is controlled by major players who provoke large movements of quotations. In theory, things are simple: a major player bought a large volume of an asset, and the price for it headed up; then they sell a big volume, and the price heads down. But in fact, things differ.
If a large market participant decides to buy, say, a thousand lots of stocks (and one lot is a hundred stocks), sellers might simply lack such a volume. The market has liquidity, and accumulating positions might take long.
In the stock market, traders get the real volume and all the data connected to it. However, a question appears: where to take order volumes in Forex?
Among traders practicing the VSA Method, many use volumes from futures, however, the number of instruments for analysis here is limited. Hence, what is left are volume indicators and tick volumes. Analysis shows that tick volume in MT4 suits well the VSA Method.
To a trader with a small capital, this information gives a small advantage. They can open position in the same direction with a major player. There is a concept that major market participants get access to more information and have more experience compared to individual investors and traders.
How to trade by the VSA Method?
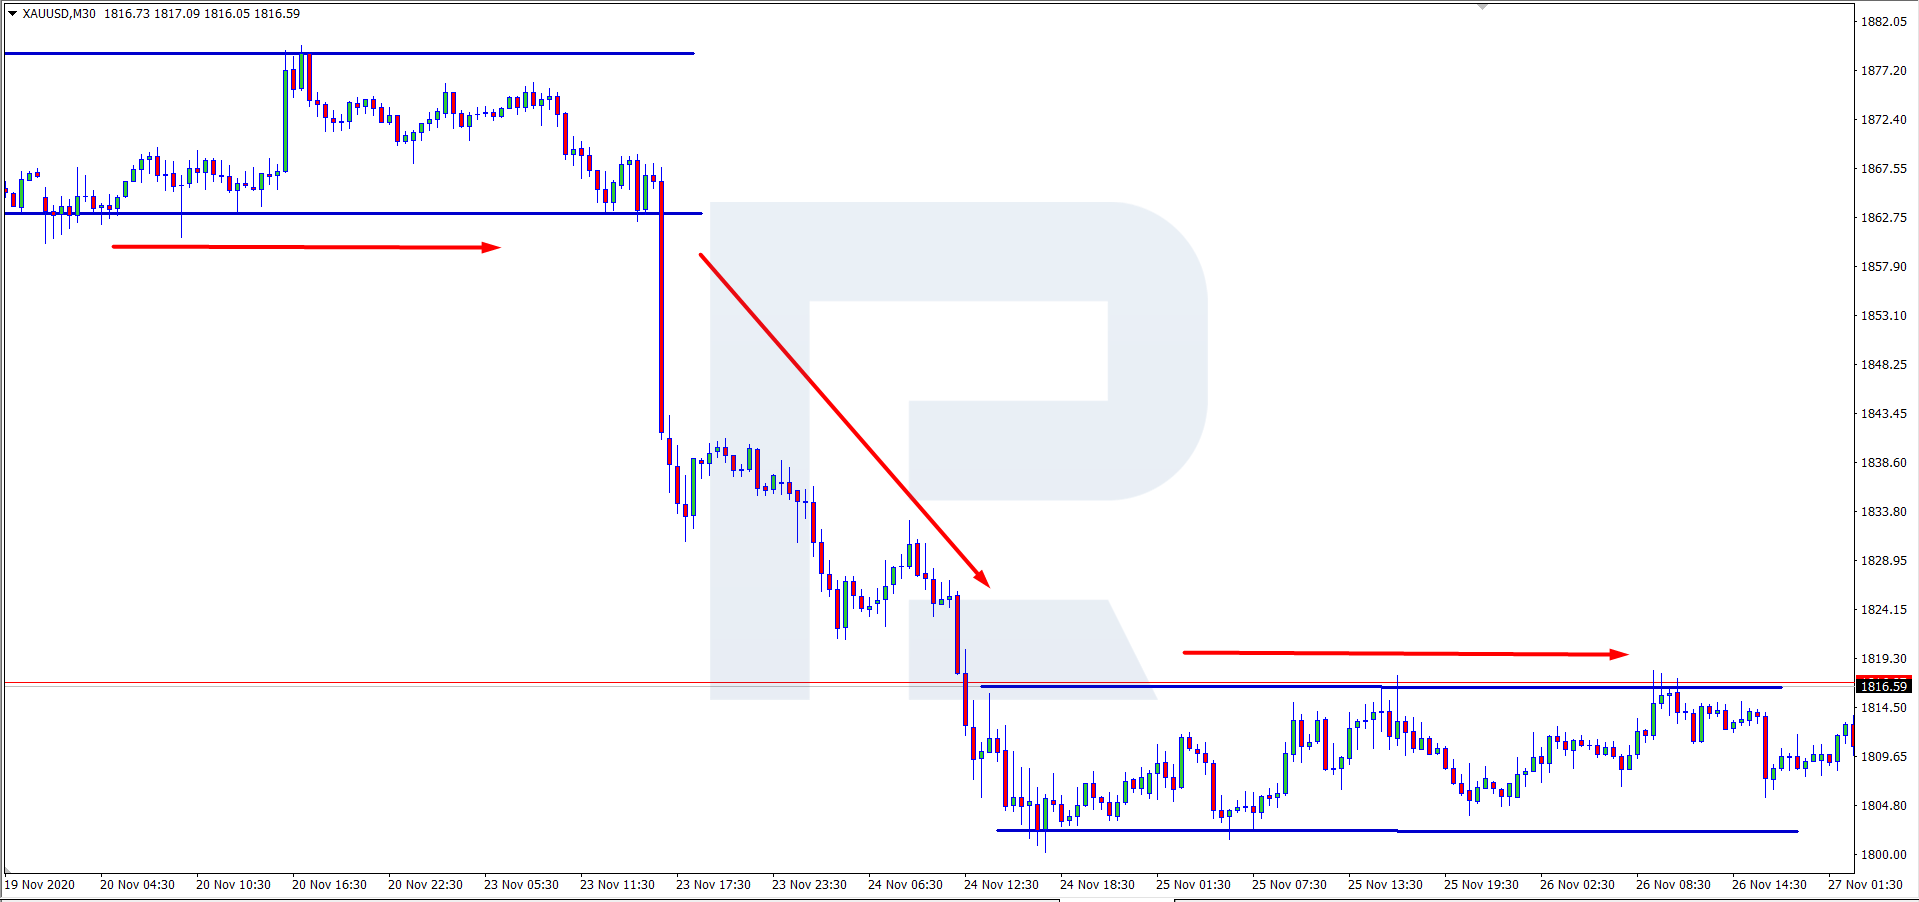
The working principle of the method is to look for places of possible reversals or escapes from flats. Reversals are frequent on highs and lows.
A breakaway of a horizontal channel
Upon sonsolidating in a flat, the quotations approach the upper border of the channel. After a test of the resistance line, the indicator of tick volumes show a large candle which means the volume has increased. Then the border of the channel got broken, and the quotations started developing an uptrend.
Note that the candlestolicks formed after the breakaway are Up Bars (the closing price of the next candlestolick is above that of the previous one).
These signals are not enough to open a position buy the VSA Method suggests further growth. Hence, we use this signal solely to confirm the ascending dynamics.
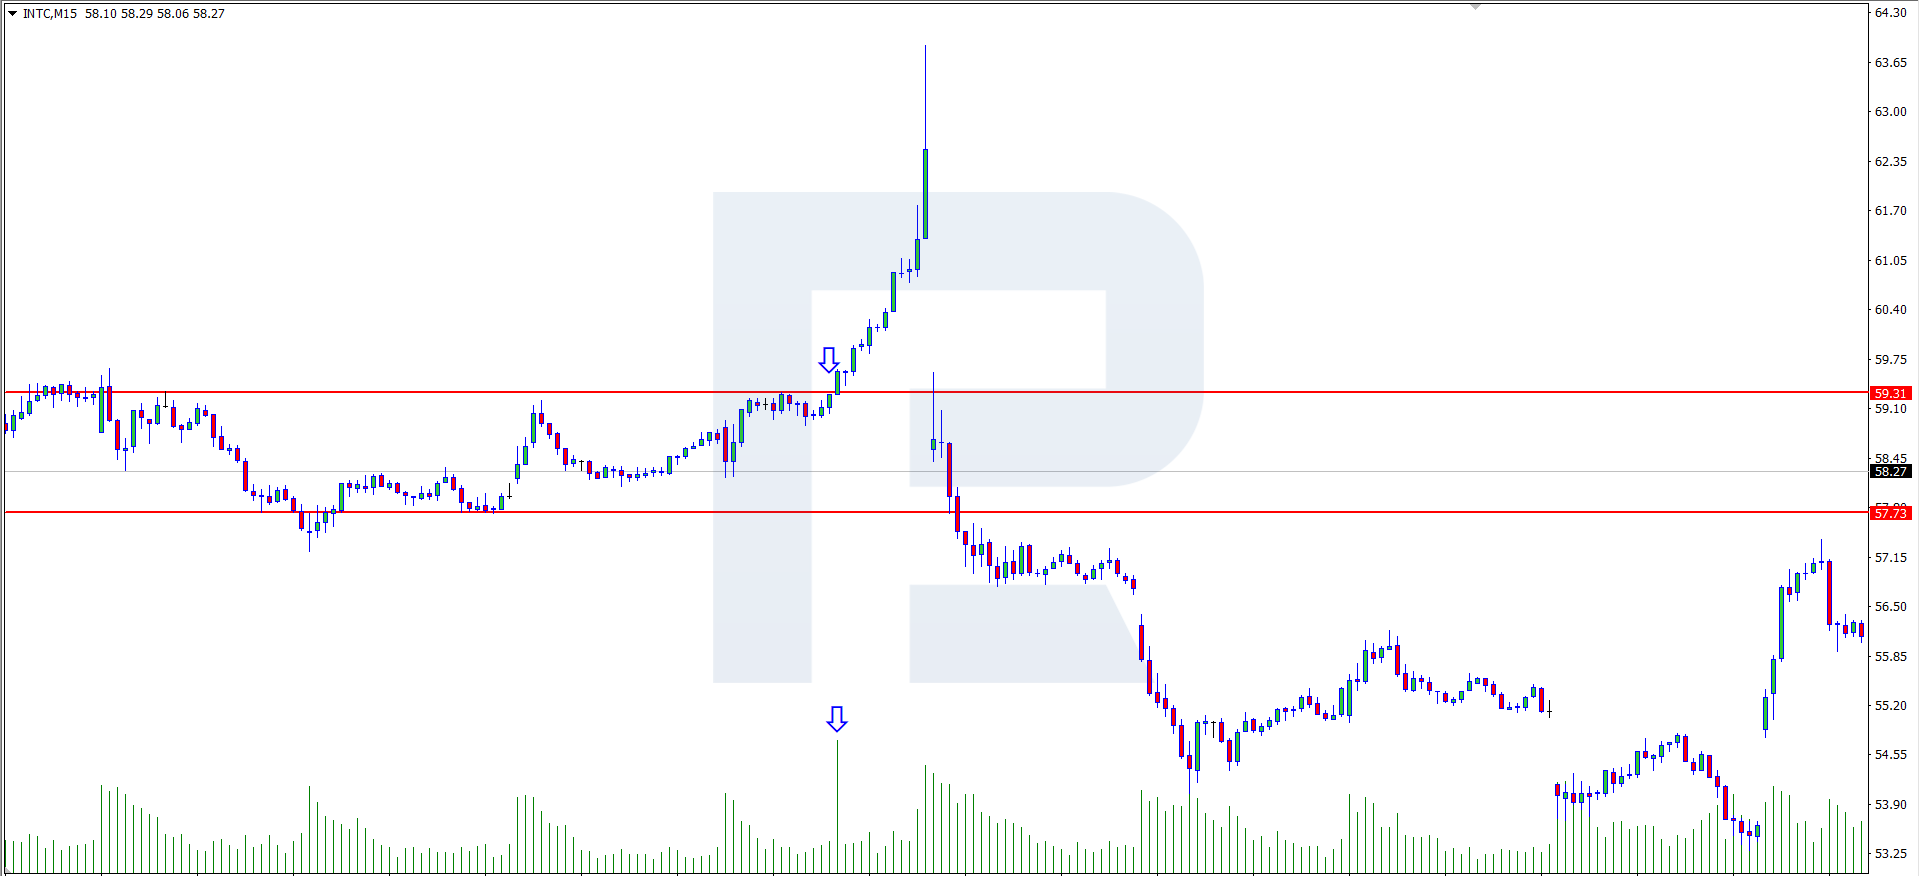
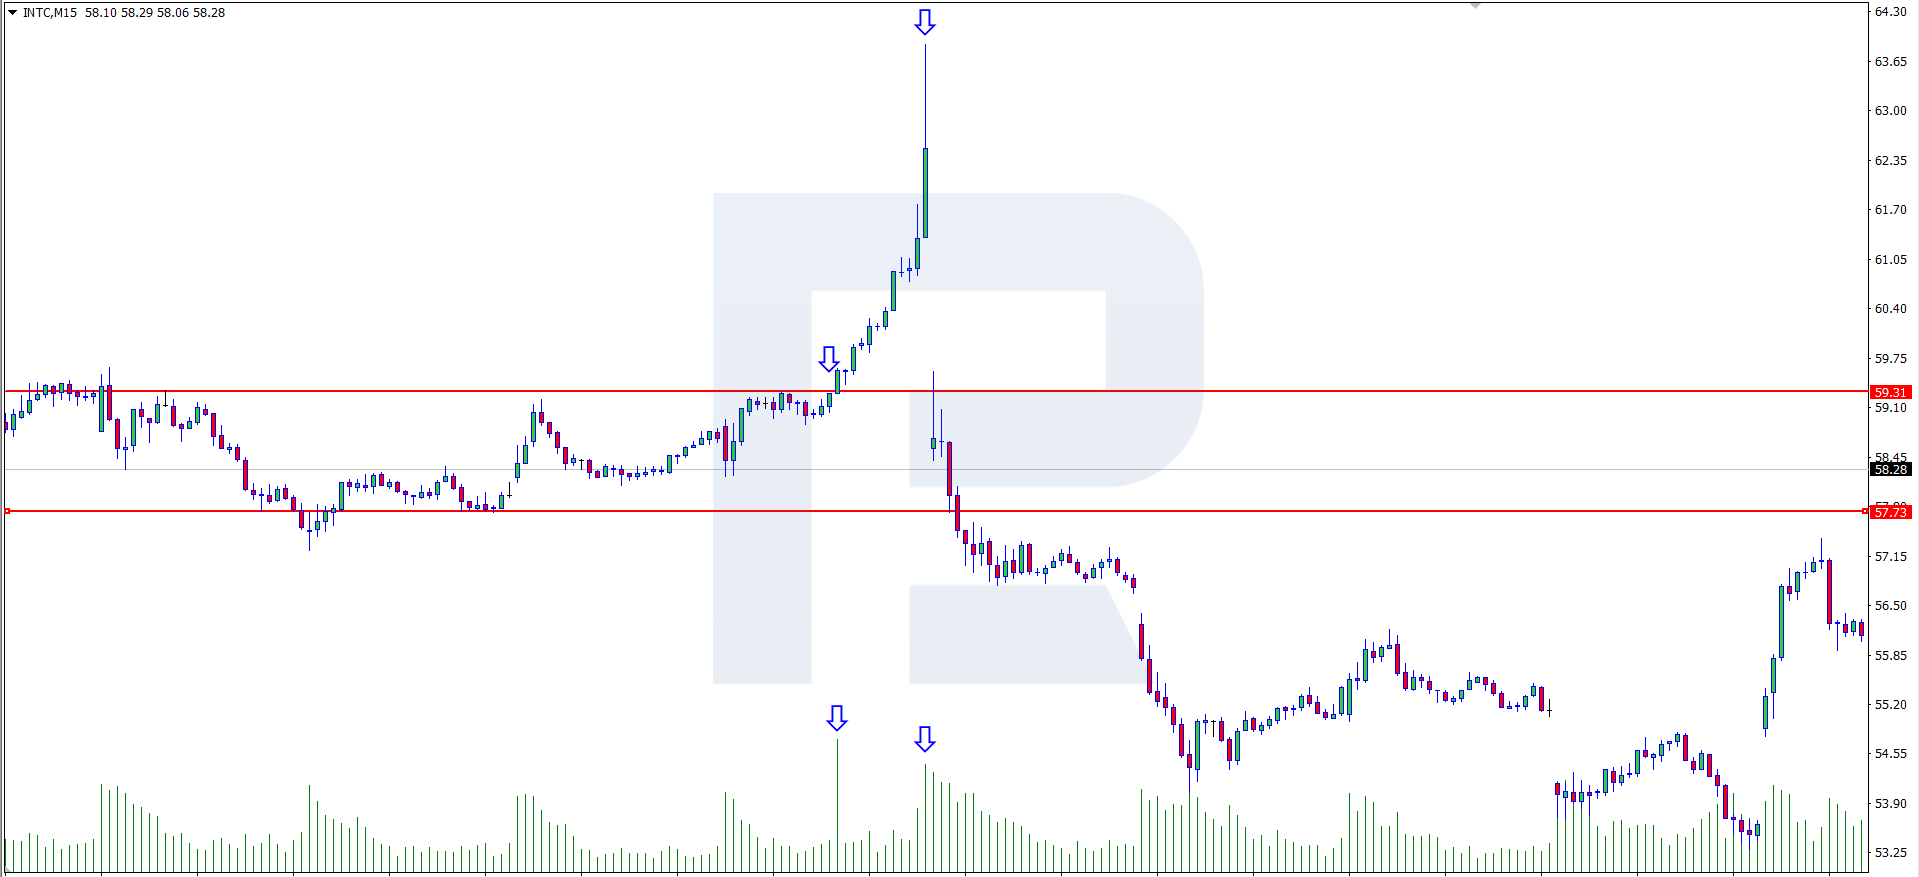
A reversal at the top of the trend
In the previous example, we saw the price grow steeply alongside trade volume. As long as not all market players closed their positions at this growth, they will start doing it when the price reaches certain highs. At that moment, they will take the profit, and trade volumes will grow again. As you can see in the picture below, the candlestick has a large shadow, which means sellers dominate over buyers. The histogram of the tick volume in this candlestick has also increased. These factors together advocate a reversal, and the chart shows that the price did fall in the end.
Attentive readers, knowledgeable of the basics of candlestick analysis, must have noted that the VSA method uses reversal patterns from this classic type of analysis. This method also forms the base of a popular strategy Price Action.
Closing thoughts
In this overview, I have described just a small part of the method. To start using it in practice, you will need to understand market mechanisms and trend principes quite well. I would say the very VSA Method is quite simple to use but you have to invest your time and effort in studying the market.
Though universal, this method is not a ready-made trading strategy. Traders use the method to understand the situation in their asset better and draw conclusions about further development of the situation.
The VSA Method will be optimal as an additional filter informing about the direction of quotations. It also works well with candlestick analysis and graphic patterns.