How to Trade by the Two Fingers Strategy?

5 minutes for reading
In this overview, I will present a simple but popular strategy called Two Fingers. The idea of the strategy is to find signals of the main market trend after a correction.
How does the strategy work?
Two Fingers can be called a medium-term strategy: it takes several days for signals to form and work. As long as it is very simple, it suits any currency pair.
The main idea of the strategy is to find a strong market trend and open a position in a correction. Look for a trend on D1 and for entry points — after a correction on a smaller H4 timeframe.
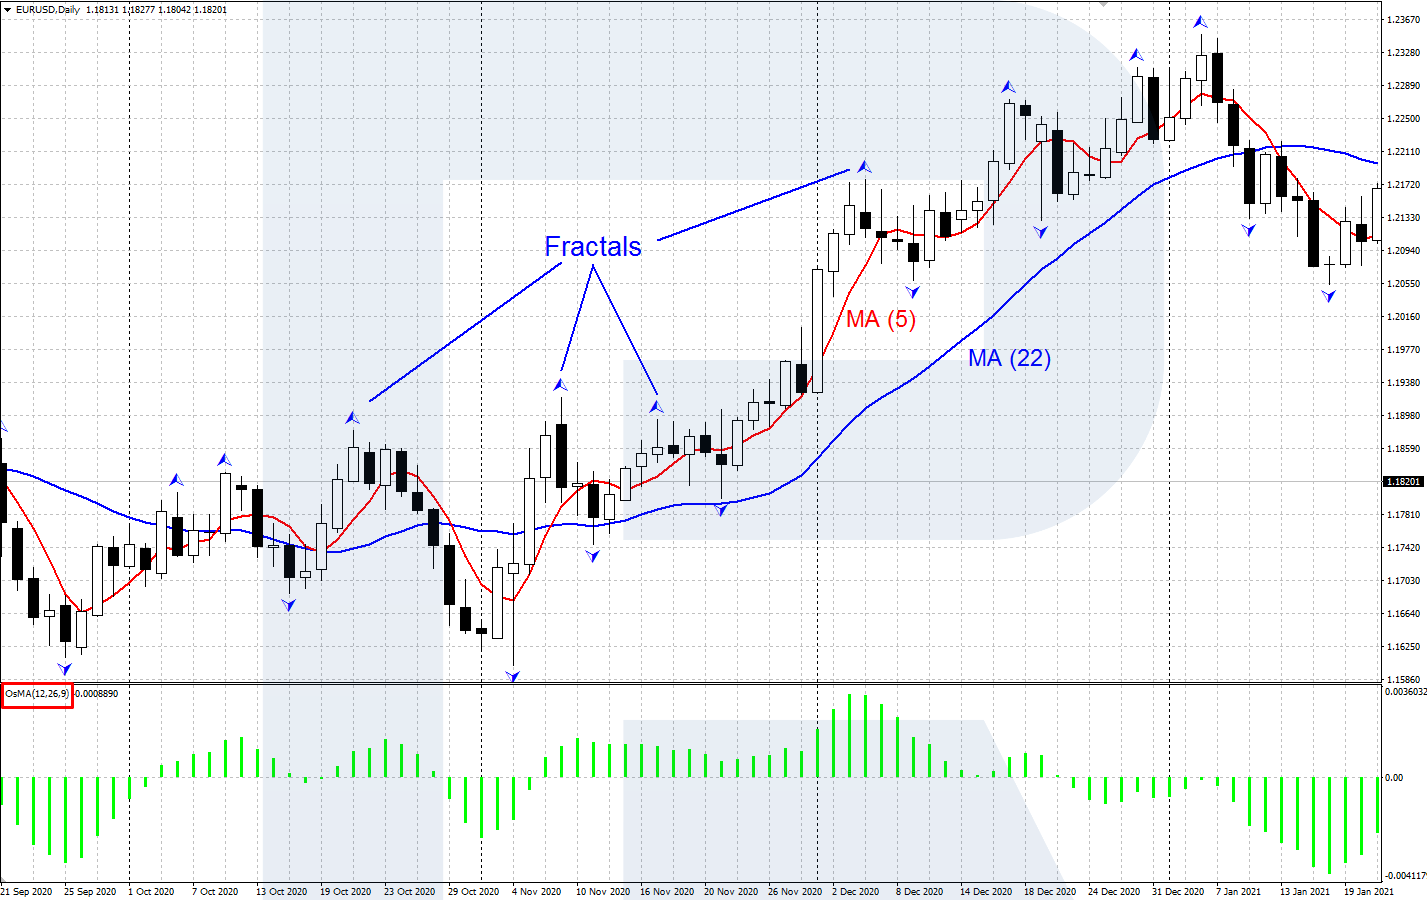
Two Fingers is an indicator strategy. To find the trend and signals, the strategy uses 4 indicators:
I will give you examples of trading by the strategy later, and here, I will briefly describe its logic and principle:
To find the trend on D1, use the crossing of the MAs. Then wait for a correction to form and a signal to appear on Fractals. Then OsMA signals to enter the market. Place a Stop Loss and Take Profit — congratulations, you have just entered the market by the strategy.
Now — to the details. Let us start with installing the indicators.
Installing the indicators by the strategy
The indicators used in the strategy are standard and available in basic MetaTrader 4 and MetaTrader 5. Open and install the indicators via the Main menu: Insert/Indicators.
To trade by Two Fingers install four indicators on the chart of your instrument:
- MA 1: period 5, method: Simple, apply to: Close, style: choose red.
- MA 2: period 22, method: Simple, apply to: Close, style: choose blue.
- Fractals by Bill Williams.
- OsMA with the following parameters: fast EMA: 12, slow EMA: 26, MACD SMA: 9.
To avoid repeating the whole process each time you start trading, you can save this set of indicators in MT4 and MT5 as a template. Right-click the window with the indicators and choose Template/Save template/Two fingers.
It will be equally simple to open the template on a new chart: right-click the window, go to Template, and choose Two Fingers. If you cannot find the name on the quick access list, click Upload template and choose the one you need.
Trading algorithm
Here is the trading algorithm of the strategy in more detail.
Step 1
On D1, define the trend by the two MAs. If the market is growing, and the red MA(5) is above the blue MA(22), the trend is ascending. If the quotations are declining, and the red MA(5) is below the blue MA(22), the trend is descending.
Step 2
On D1, at the last high (in am uptrend) or low (in a downtrend) of the price, a Bill Williams's Fractal must form. In an uptrend, it must be upper, in a downtrend — lower.
Step 3
On D1, draw a horizontal level through the low/high of the last daily candlestick of the fractal (the second candlestick after the fractal icon). If the fractal is upper (in an uptrend), draw the line through the low, is the fractal is lower (in a downtrend) — through the high.
Step 4
Switch to H4. Wait for an entry signal from OsMA. in an uptrend, the histogram of the indicator must cross 0 from below; in a downtrend — from above.
Step 5
A condition to be met (filter) is the position of the price against the horizontal level through the low/high of the last candlestick. In an uptrend, at the OsMA signal to buy, the price must be above this level. In a downtrend, at the OsMA signal to sell, the price must be under this level. If something is wrong here, skip the signal.
Step 6
H4 timeframe. After opening the position, place a Stop Loss behind the nearest local low/high on the chart. Later, if the price goes beyond the SL heading for the TP, you can move the SL to the entry point.
Step 7
H4 timeframe. To take the profit, you can use the following signals:
- OsMA histogram crossing 0 back
- MA(5) and MA(22) crossing back.
- The price reaching a strong support/resistance level
- The Stop/Profit ratio becoming more than 1:2.


Examples of trading by Two Fingers
Let me show you several examples of buying and selling by the strategy:
A buying trade
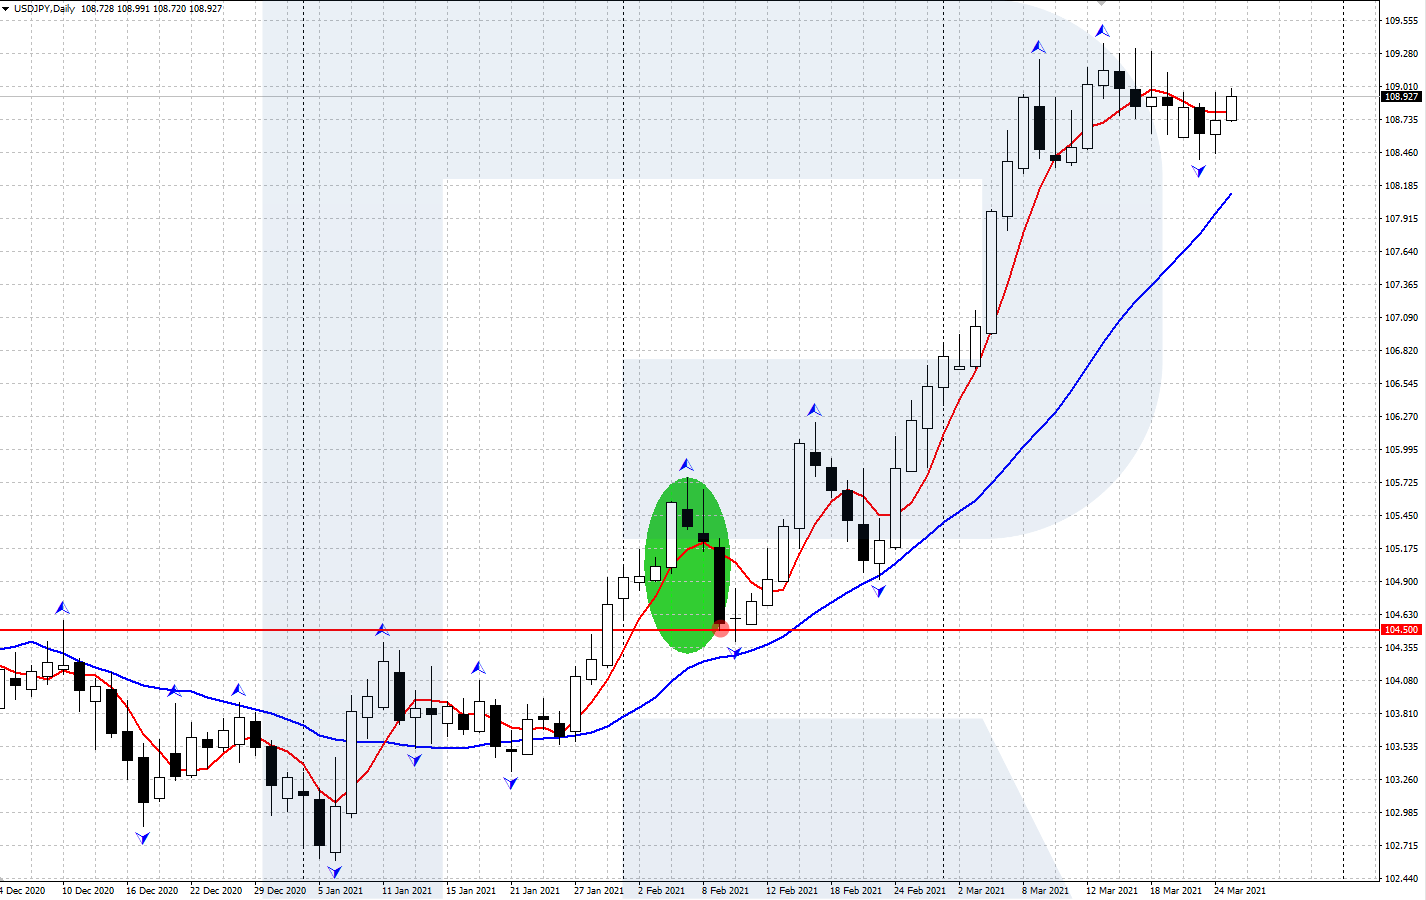
- On D1 of USD/JPY there is an uptrend. The red MA(5) is above the blue MA(22).
- On D1, an upper Williams's Fractal has formed.
- Draw a horizontal level through the high of the second candlestick after the fractal icon (104.50).
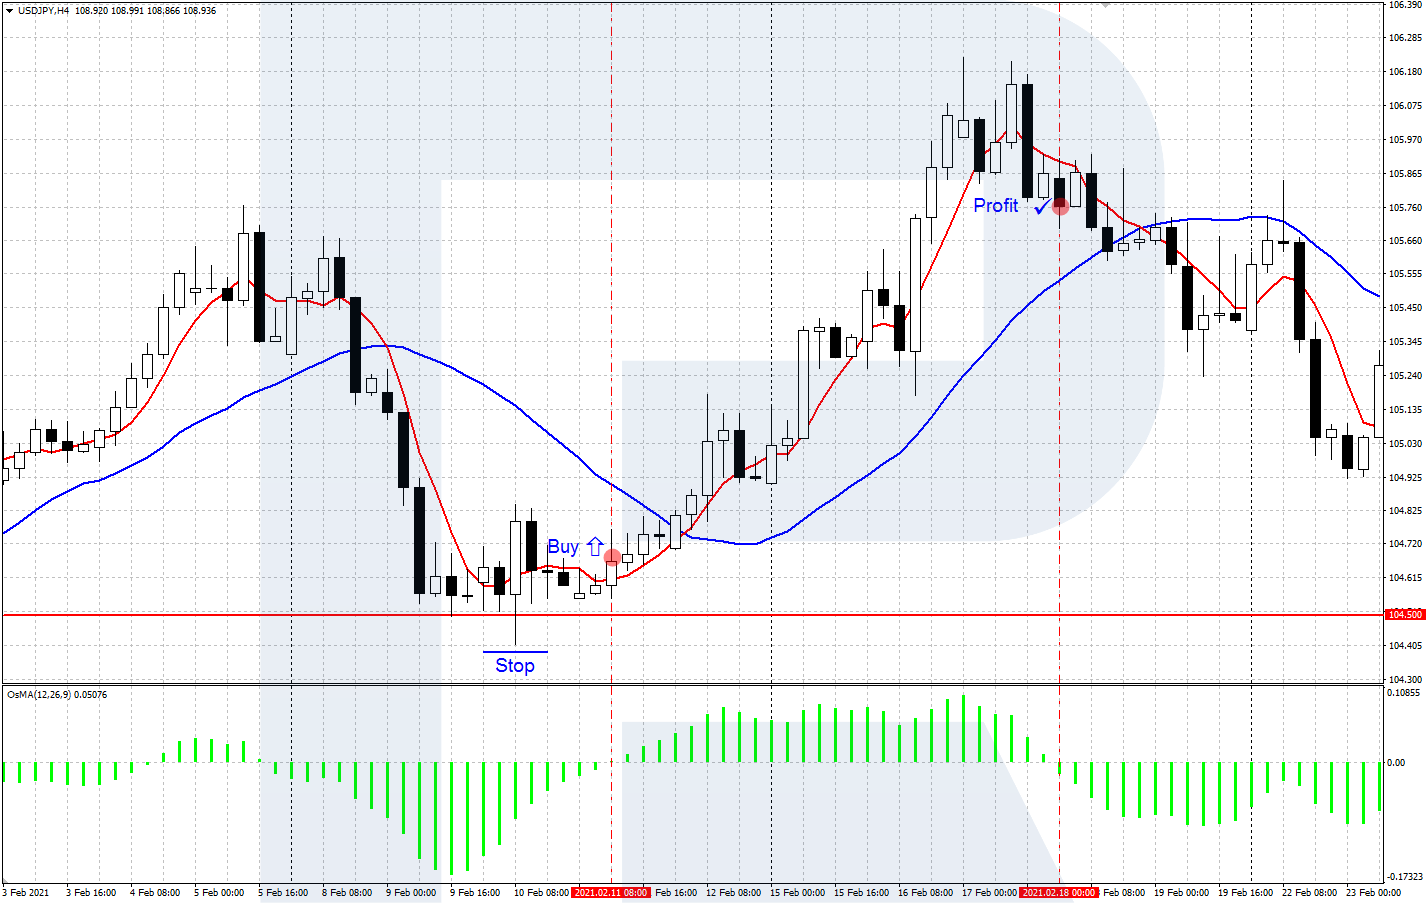
- Switch to H4, wait for the OsMA histogram to cross 0 from below.
- Check the condition: at the moment the OsMA signal appeared, the quotations were above 104.50. Open a buying position.
- Place an SL behind the local low on H4.
- Take the profit when the OsMA histogram crosses 0 from above.
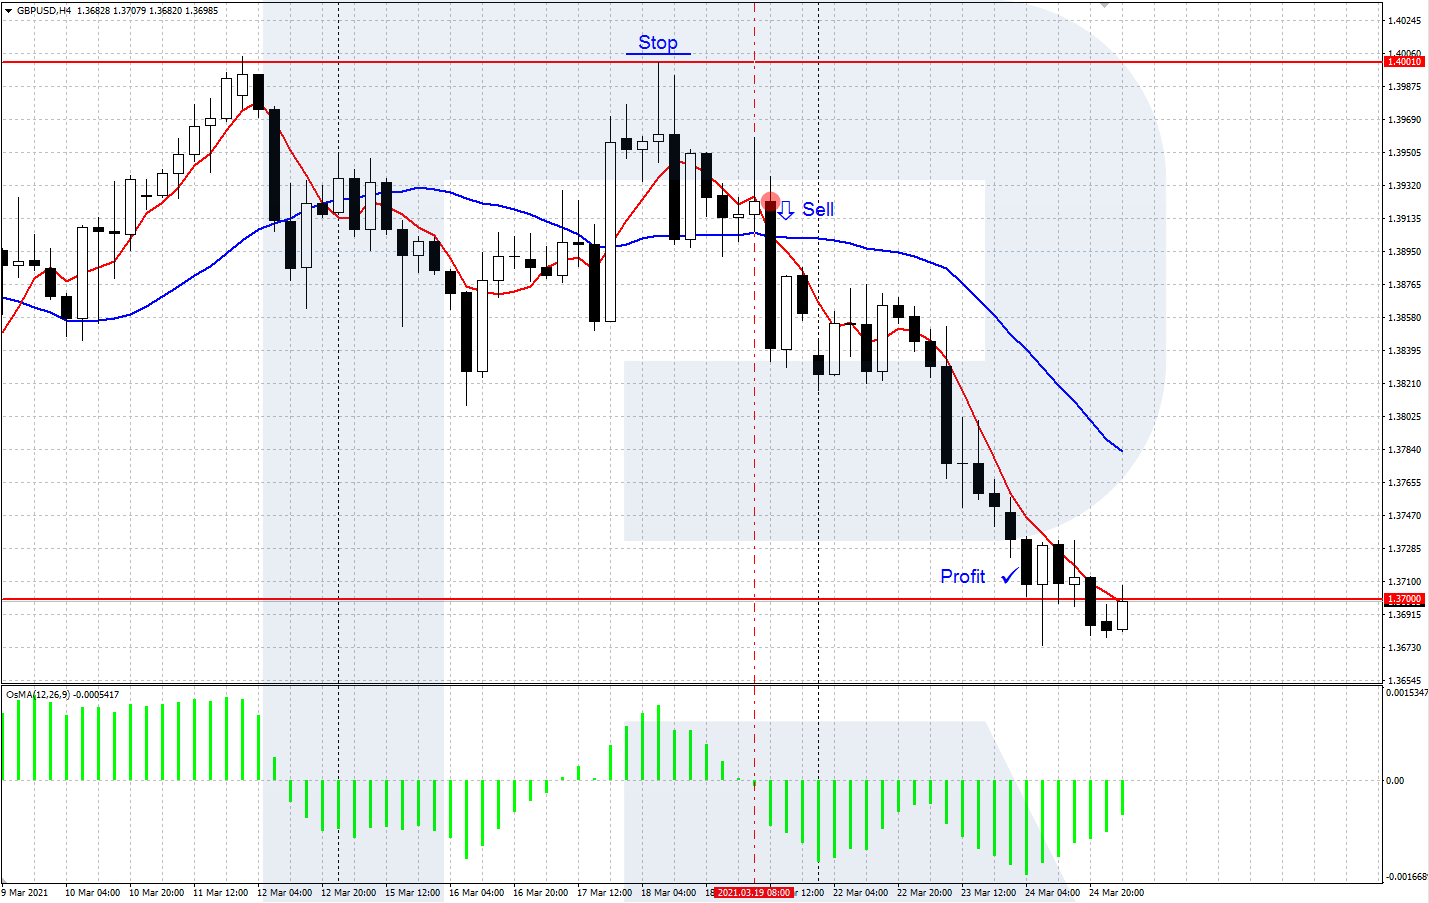
A selling trade
- On D1 of GBP/USD a downtrend has started. The red MA(5) is below the blue MA(22).
- A lower Fractal forms on D1.
- Draw a horizontal line through the high of the second candlestick after the fractal icon (1.4001).
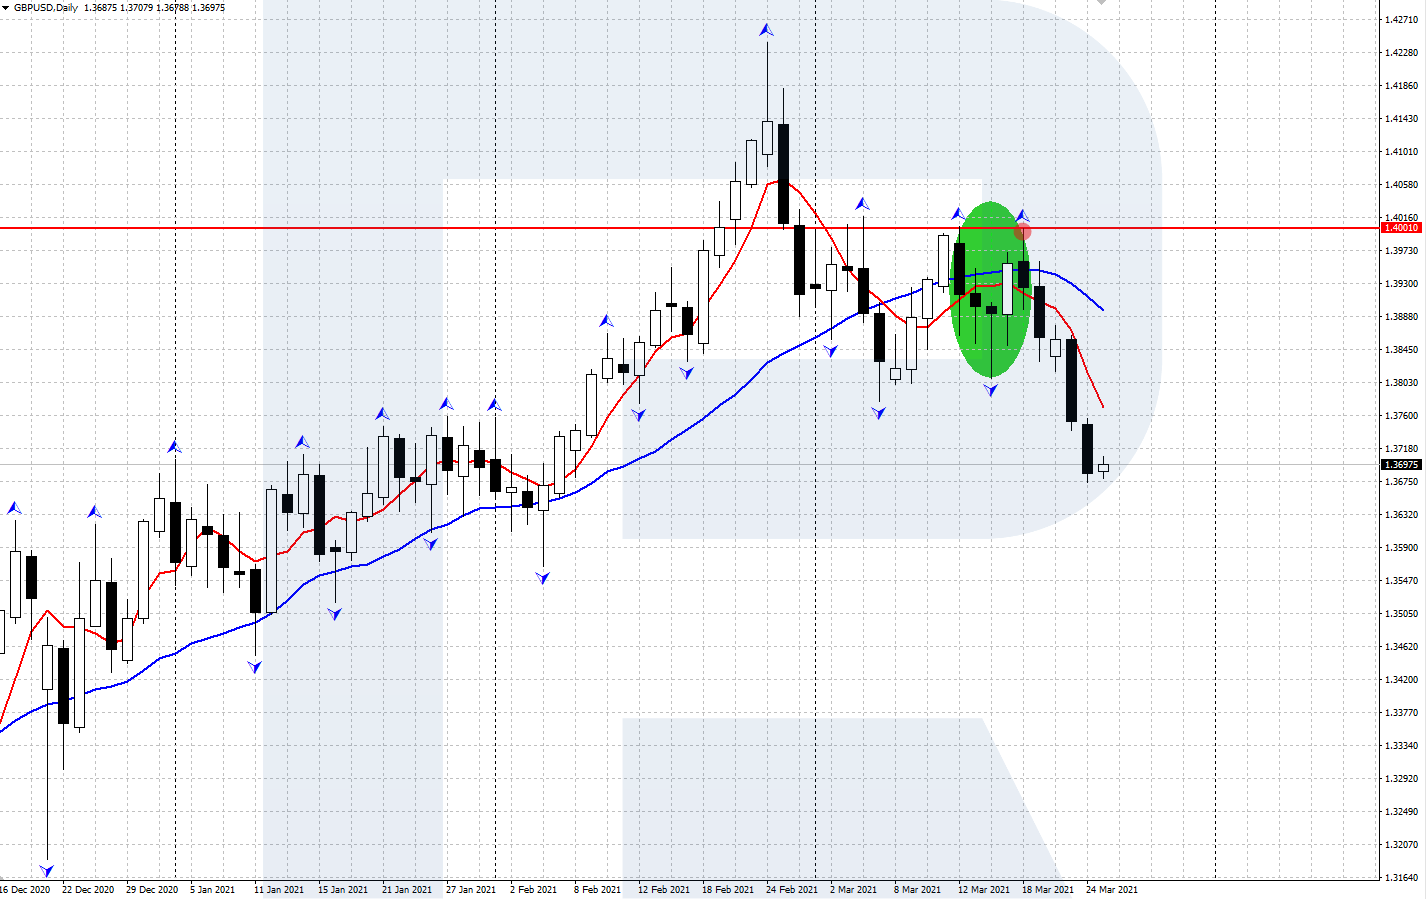
- Switch to H4, wait for the OsMA histogram to cross 0 from above. Check the condition: when the signal from OsMA appeared, the quotations were below 1.4001.
- Open a selling position.
- Place an SL behind the local high on H4.
- Take the profit when the Stop/Profit ratio reaches 1:2.
Bottom line
Two Fingers is a trend strategy; it is based on trading the trend after a correction. This is a medium-term strategy which signals appear and work during several days. Reagrdless its rules being so clear, test it on a demo account and make sure it works well.


