How to Trade the Engulfing Pattern?

5 minutes for reading
This overview is devoted to the Engulfing pattern; to how it forms and works. This candlestick pattern is easy to note on the chart. It forecasts a reversal of the actual trend.
How does the Engulfing pattern form?
The Engulfing pattern is a reversal candlestick pattern that forms on the local highs and lows of the price chart in an uptrend or downtrend. It consists of two candlesticks: the first one has a relatively small body, while the second one is of the opposite color and has a larger body that fully covers (engulfs) the first candlestick.
In terms of the market behavior, an Engulfing pattern means that the actual trend is losing its power and tempo — the first candlestick demonstrates this. The previous movement loses strength, and the market balance is feeble.
The appearance of the next mighty candlestick of the pattern that engulfs the previous one and closes in the opposite direction, signifies the beginning of a correction that might even turn into a reversal of the current trend.
Types of the Engulfing pattern
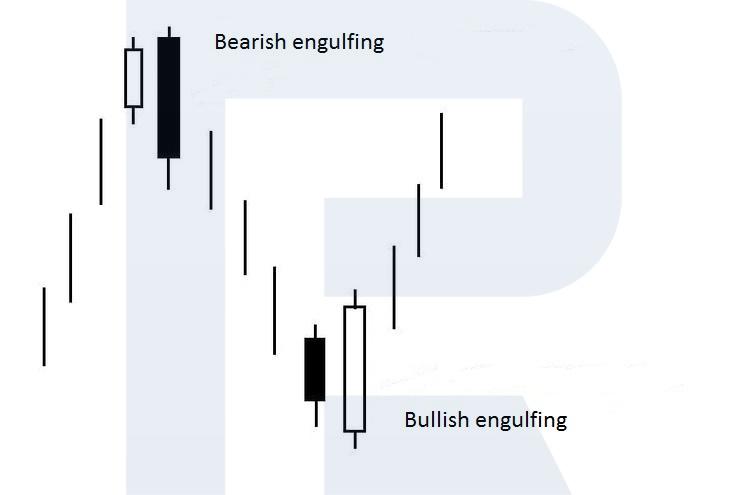
Depending on the color of the second engulfing candlestick, two types of the pattern are sungled out: the Bullish engulfing and the Bearish engulfing.
Bullish engulfing
The pattern forms in a downtrend at the local lows of the price chart. The first small black candlestick of the pattern shows that bears are losing power; then a large white candlestick appears, fully engulfing the body of the first one. This means that bulls are advancing, feeling the bears' weakness.
Next thing, the price goes upwards, and an ascending correction starts. This is confirmed by the quotations rising higher than the high of the large bullish candlestick, the second one.
Bearish engulfing
The pattern forms in an ascending impulse at the local highs of the price chart. The first small white candlestick means that bulls are tired and need a pause. The large black candlestick that follows shows that bears are using their chance, counterattacking.
Then the quotations go down, and a descending correction starts. This is confirmed by falling under the low of the second candlestick, the large and white one.

Trading the Engulfing
As long as this is a reversal pattern, there must be an ascending or descending price movement before it; an Engulfing in a flat should be ignored. Best timeframes for trading are larger ones, from H1 and higher. Best assets are high-liquid ones: currency pairs, gold, oil, stocks, stock indices.
Bullish engulfing — buying
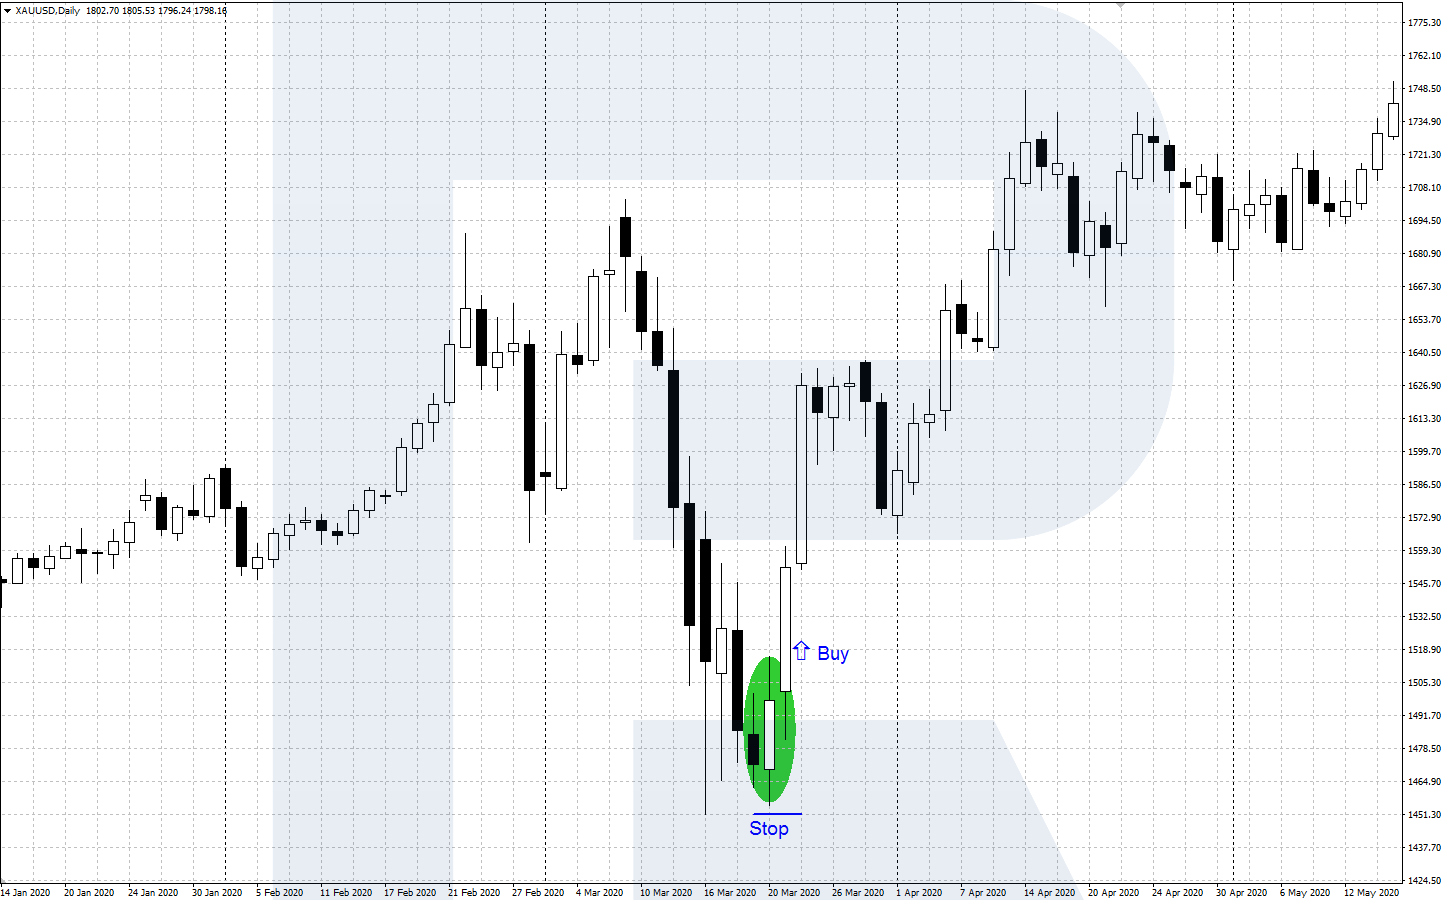
The trading algorithm of the bullish pattern looks as follows:
- In a downtrend, a reversal candlestick pattern called Bullish engulfing forms at the local lows of the chart.
- Open a buying position after the price exceeds the high of the engulfing white candlestick (the second one in the pattern).
- After you open your position, place a Stop Loss a bit lower than the deepest low of both candlesticks in the pattern.
- Take the profit when the price reaches an important resistance level or some signs of a reversal downwards appear.
Bearish engulfing — selling
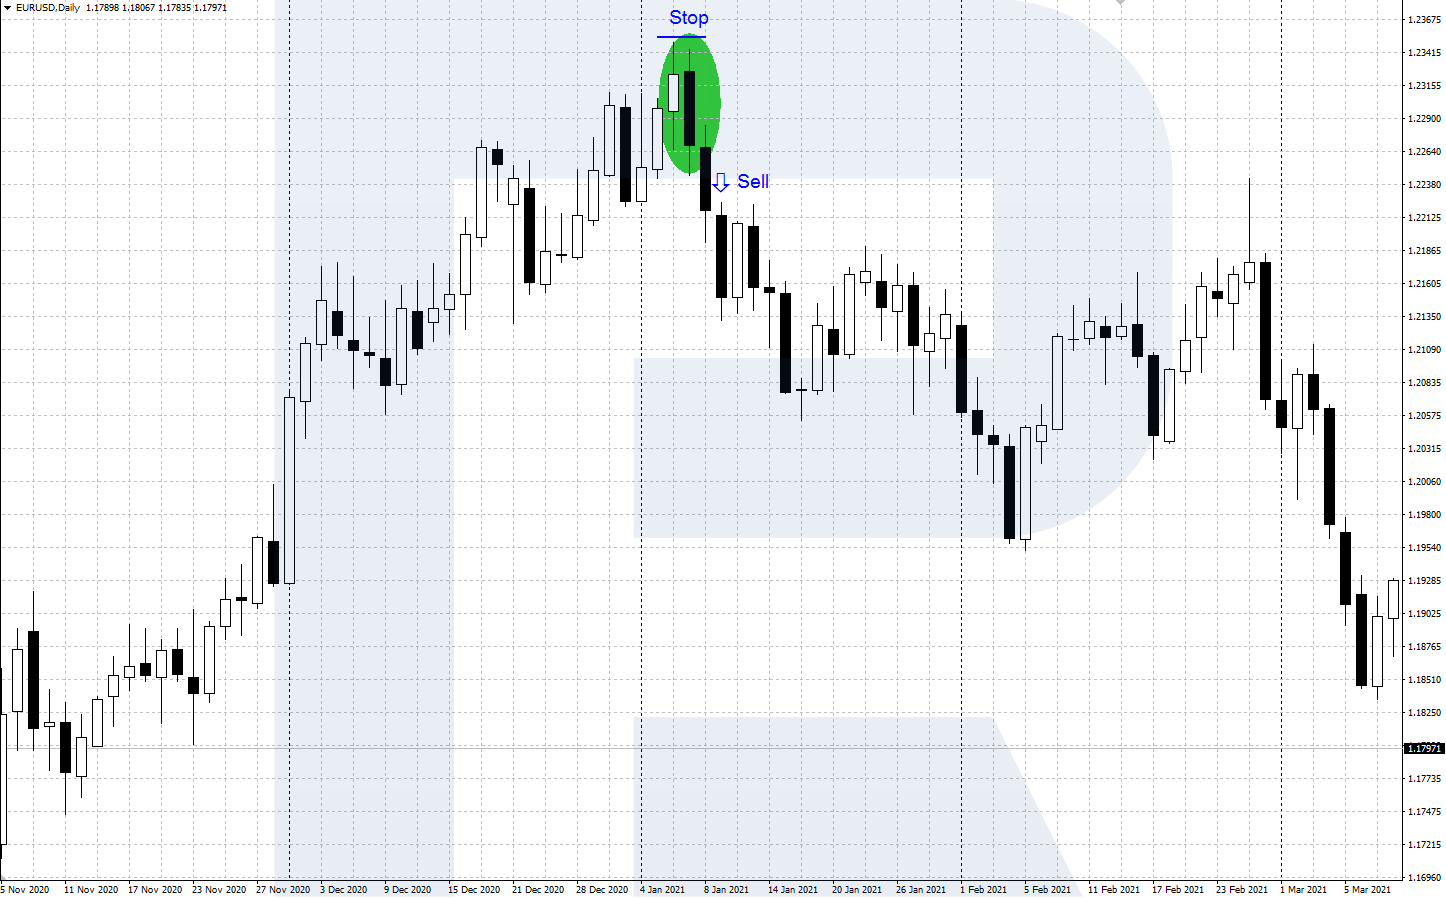
The trading algorithm of the bearish pattern looks as follows:
- In an uptrend, a reversal candlestick pattern called Bearish engulfing forms at the local highs of the chart.
- Open a selling position after the price drops below the low of the engulfing black candlestick (the second one in the pattern).
- After you enter the market, place a Stop Loss a bit higher than the biggest high of both candlesticks in the pattern.
- Take the profit when the price reaches an important support level or some signs of a reversal upwards appear.
What enforces the Engulfing
A well-known trader and analyst, the popularizer of candlestick analysis Steve Nison singles out several factors that "enforce" the pattern, or increase its efficacy.
- The pattern appears at the classic support/resistance levels from tech analysis.
- The first candlestick is a Doji: it has almost no body, while the opening and closing prices stay very close to each other or coincide. A Doji means that the market situation is vague, and a reversal might follow.
- A full-scale engulfing happens, the shadows of the second candlestick fully overlap the shadows of the first one. In other words, not only the body of the first candlestick stays within the body of the second one, but also its highs and lows stay within the highs and lows of its counterpart.
Closing thoughts
Reversal candlestick patterns called Bullish engulfing and Bearish engulfing form at the local extremes of the price chart in an uptrend or downtrend. They predict a possible correction or even a reversal.
The efficacy of the patterns increase in presence of certain enforcing factors and alongside tech analysis patterns, support/resistance levels, and signals of trading indicators. Before trading for real, practice the patterns on a demo account.
Further reading about other candlestick patterns here:


