How to Work in Flat Market: Trading Strategy

6 minutes for reading
Experienced traders prefer working by the trend, while beginners usually choose trading in ranges. This article is devoted to a strategy meant for working in a range.
Authors claim that the advantage of this strategy for trading in the flat market is its universal application: it suits any instrument. However, rules are strict for the timeframe — H1 only. Hence, this is a medium-term strategy, best for a trader who enters the market rather often.
The strategy uses two standard MetaTrader indicators, which is another advantage because you do not have to install and set up anything else.
The two indicators are the Bollinger Bands and Moving Average. This choice seems rather weird to me, because the most widespread pattern is combining a trend indicator and an oscillator because they show how far the price has diverged from the average, and a divergence on the MACD is a great instrument for working in the flat.
The authors of the strategy promise that the strategy is a simple and reliable trading instrument. Let us see how we can combine two trend indicators for working in a range.
Setting up indicators for the strategy
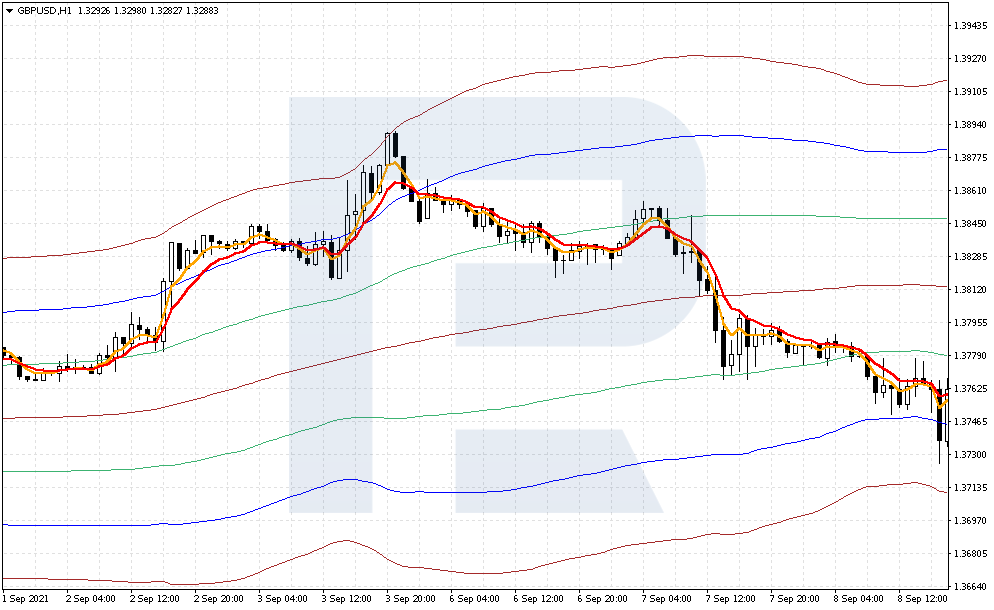
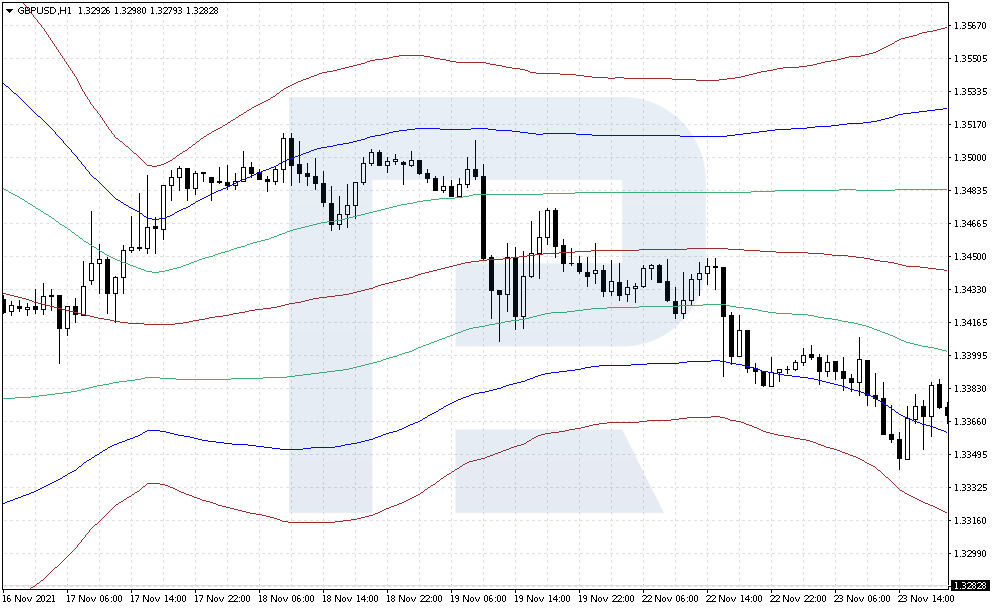
The strategy includes two indicators with different settings. Totally, you will have five indicators on the chart: three Bollinger Bands and two Moving Averages. Here are the settings and parameters:
- Bollinger Bands with period 120 and Deviation 1
- Bollinger Bands with period 120 and Deviation 2
- Bollinger Bands with period 120 and Deviation 3
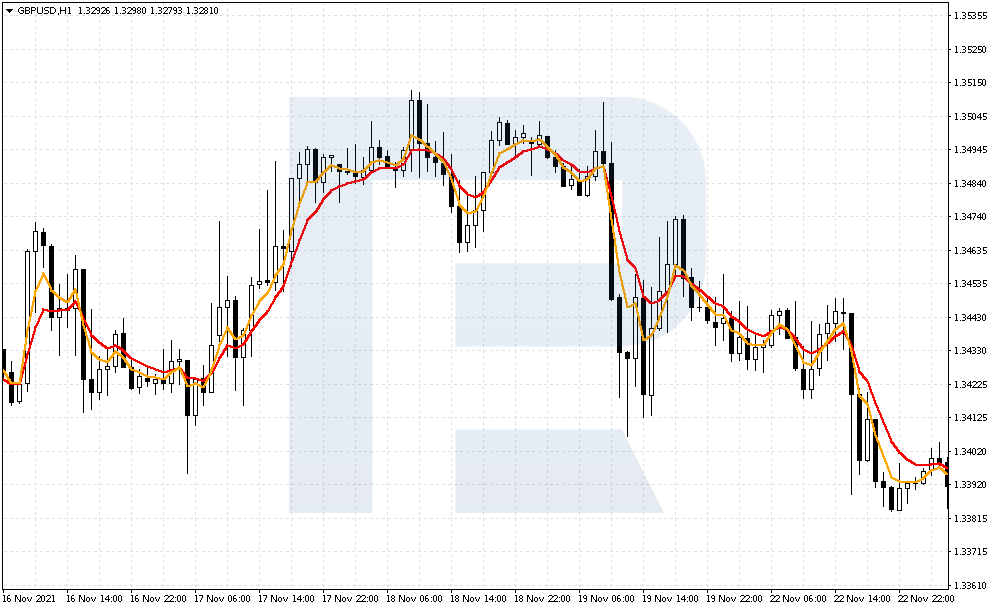
- Exponential Moving Average with period 4, color orange — this is a fast line
- Exponential Moving Average with period 8, color: red — this is a slow line.
Why will the strategy work?
Bollinger Bands show a flat movement, going horizontally. As a popular trading option for this indicator, we know a bounce off it's extreme borders. If the price sprouts to one side, either a new trend begins or this was a random surge, and the price returns inside the bands.
As John Bellinger himself put it, the price rests inside the bands 90-95% of time, while the borders set the highs and lows. Hence, if the price tests the upper border, expect a decline, and if the price approaches the lower border, wait for a bounce upwards.
As the "correct" prices we use the middle line of Bollinger Bands, so if the trader sells from the upper border, the aim will be the lower border of the bands.
The MAs are used for detecting the trend direction on large TFs. However, crossing of these lines gives signals on smaller TFs as well. In the strategy for trading in the flat market, the MAs crossing near the extremes of Bollinger Bands will signal to open a position. So, Bollinger Bands are used for finding a range while the MAs hint on the time to enter the market.
How to open a buying position by the strategy
After the chart is set up for the work, move on to the strategy rules. Here are the detailed conditions for buying:
- Bollinger Bands are narrowing, while the prices start going horizontally, without a clear market trend.
- The price bounces off one of the two lower bands; neglect bounces off the nearest indicator lines.
- Open a buying position when the fast MA crosses the slow one from below.
- The best opening option is the moment when the price bounces off Bollinger Bands extremes twice, which means buyers are strong.
Next, there are three rules:
- Place a Stop Loss 15 points below the entry point.
- Place a Take Profit 15-20 points above the entry point.
- If the price breaks through the middle Bollinger Bands line, you may close the position.
Example of a buying trade
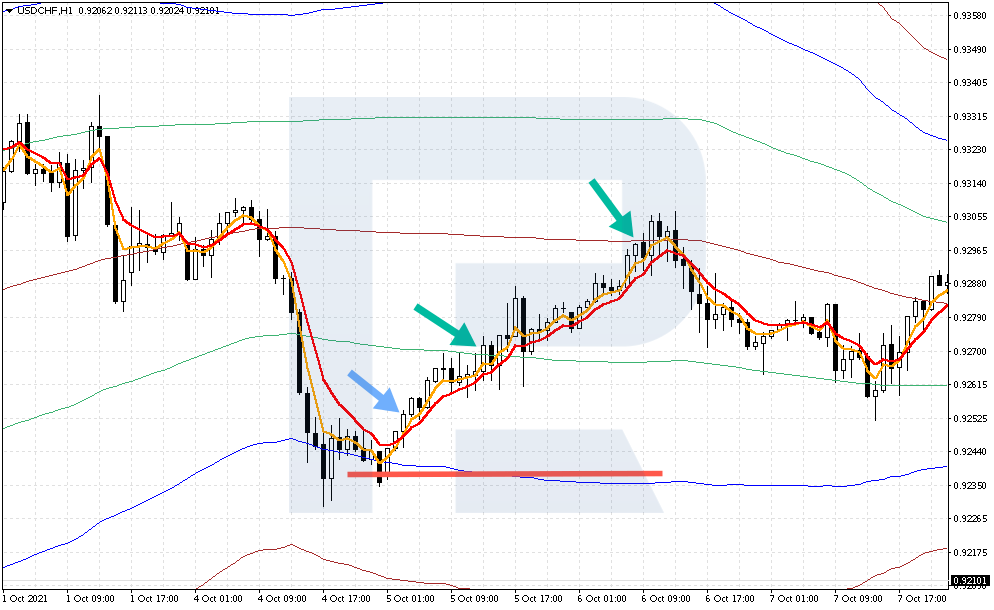
Let us Open a buying position in USD/CHF. The price tested the lower border of Bollinger Bands twice, while the bands are moving horizontally. Wait for the crossing of the MAs and open a position. As you see, the crossing happened at 0.9252.
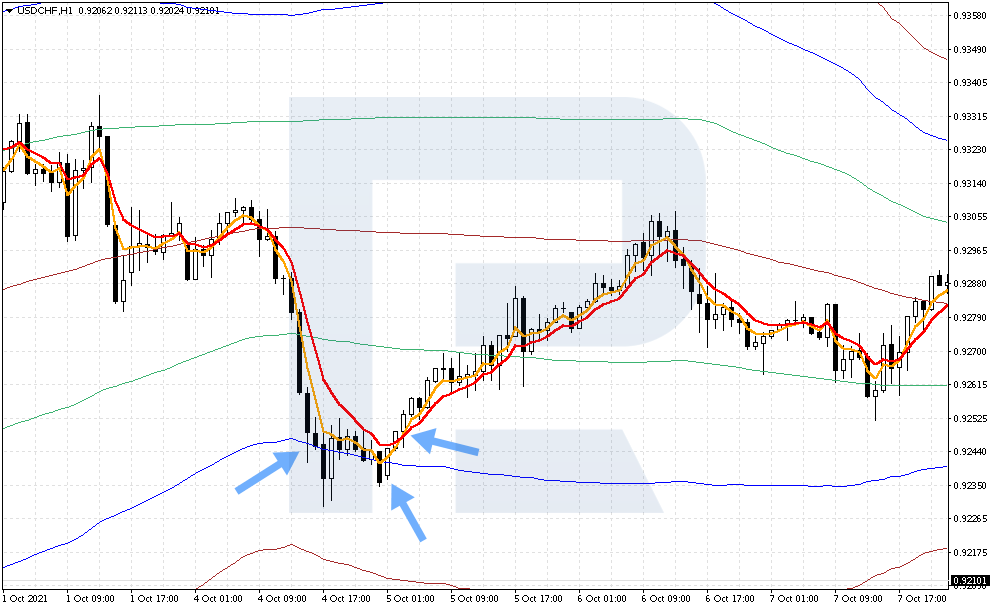
Place an SL 15 points away from the entry point, which is 0.9237. A TP should be at 0.9264 or 0.9269. The middle line of Bollinger Bands is at 0.9295, and you may hold the position up to this level because by the risk management rules, your profit must be higher than your loss. In our example, the price has covered three TP levels.


How to open a selling position by the strategy for trading in a flat market
Now let us get to the rules for opening a selling position by the strategy:
- Bollinger Bands are narrowing, going horizontally, which means the market is flat and volatility is decreasing.
- The price bounces off the upper borders of Bollinger Bands; neglect bounces off the nearest indicator lines.
- Open a selling position when the fast MA crosses the slow one from above.
- The best opening situation will be the instance when the price bounces off the Bollinger Bands extremes twice, which indicates that sellers are strong. From the points of graphic analysis, this resembles a Double Top pattern.
Here are the three rules:
- Place an SL 15 points above the entry point.
- Place a TP 15-20 points below the entry point.
- When the price breaks through the middle Bollinger Bands line, you may close the position.
Example of selling trade
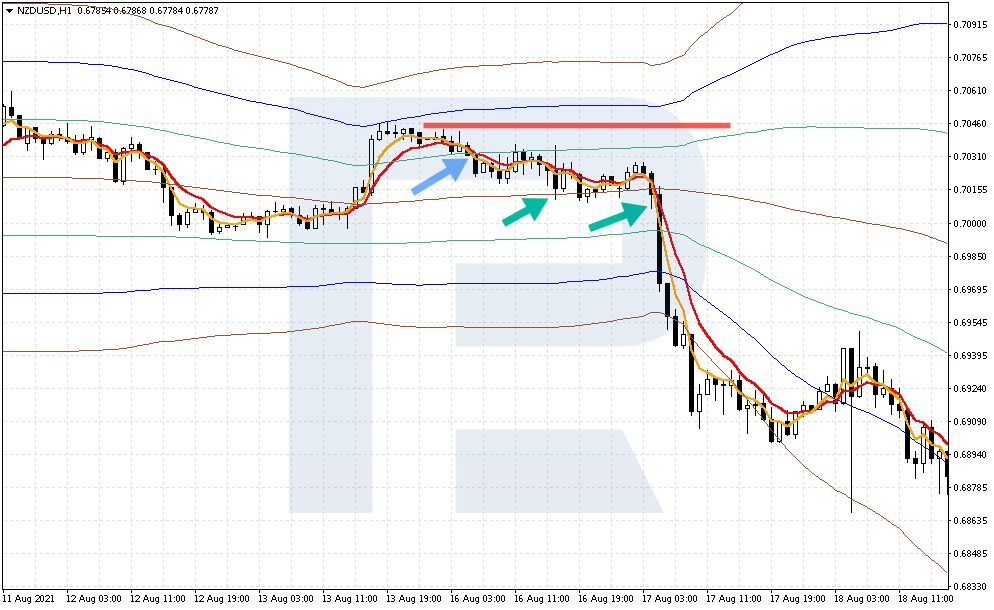
Here is how we open a selling position in NZD/USD. The price bounces off the upper border of Bollinger Bands, and the bands are going horizontally. As you remember, two bounces will be a strong signal but just one is enough.
Wait for the crossing of the MAs and open a selling position. This times the MAs crossed at 0.7029.
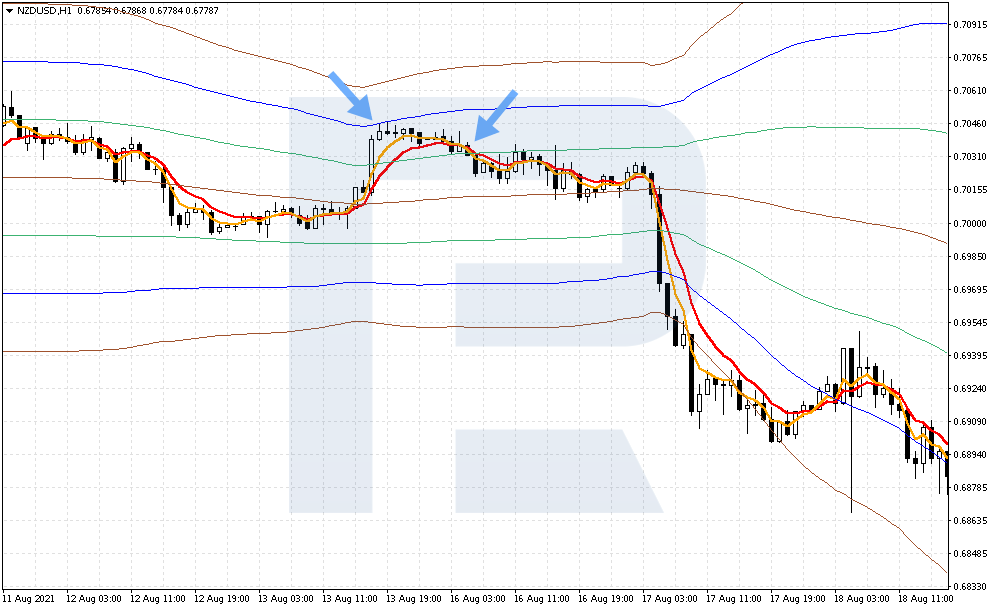
Place an SL 15 points away from the entry point, which is 0.7044. Place a TP at 0.7014 and 0.7009. The middle line of Bollinger Bands, up to which you may hold the trade, is at 0.7014. In our example, the price has covered all the three TP levels; however, there are losing positions, so always control your risks and never enter the market with your whole deposit.
Closing thoughts
According to the authors of the strategy for trading in a flat market, this strategy is a trustworthy way of working in a range. The strategy requires two standard indicators — the Bollinger Bands and Moving Average.
The disadvantages of the tactics are a risk-to-profit ratio of 1 to 1, which is not much, as long as a profitable trade will be unable to cover up for several losing ones. However, here the authors suggest holding the trade until the price reaches the Bollinger Bands middle line, which gives a much larger potential profit.
Apart from this, the strategy is an, indeed, simple working option with clear entry and exit rules.


