How to Trade the “Base 150” Strategy

6 minutes for reading
In this review article, we will talk about the medium-term indicator strategy “Base 150”. We will explain how it works, how to set the indicators, and how the strategy can be used in trading.
How the “Base 150” strategy works
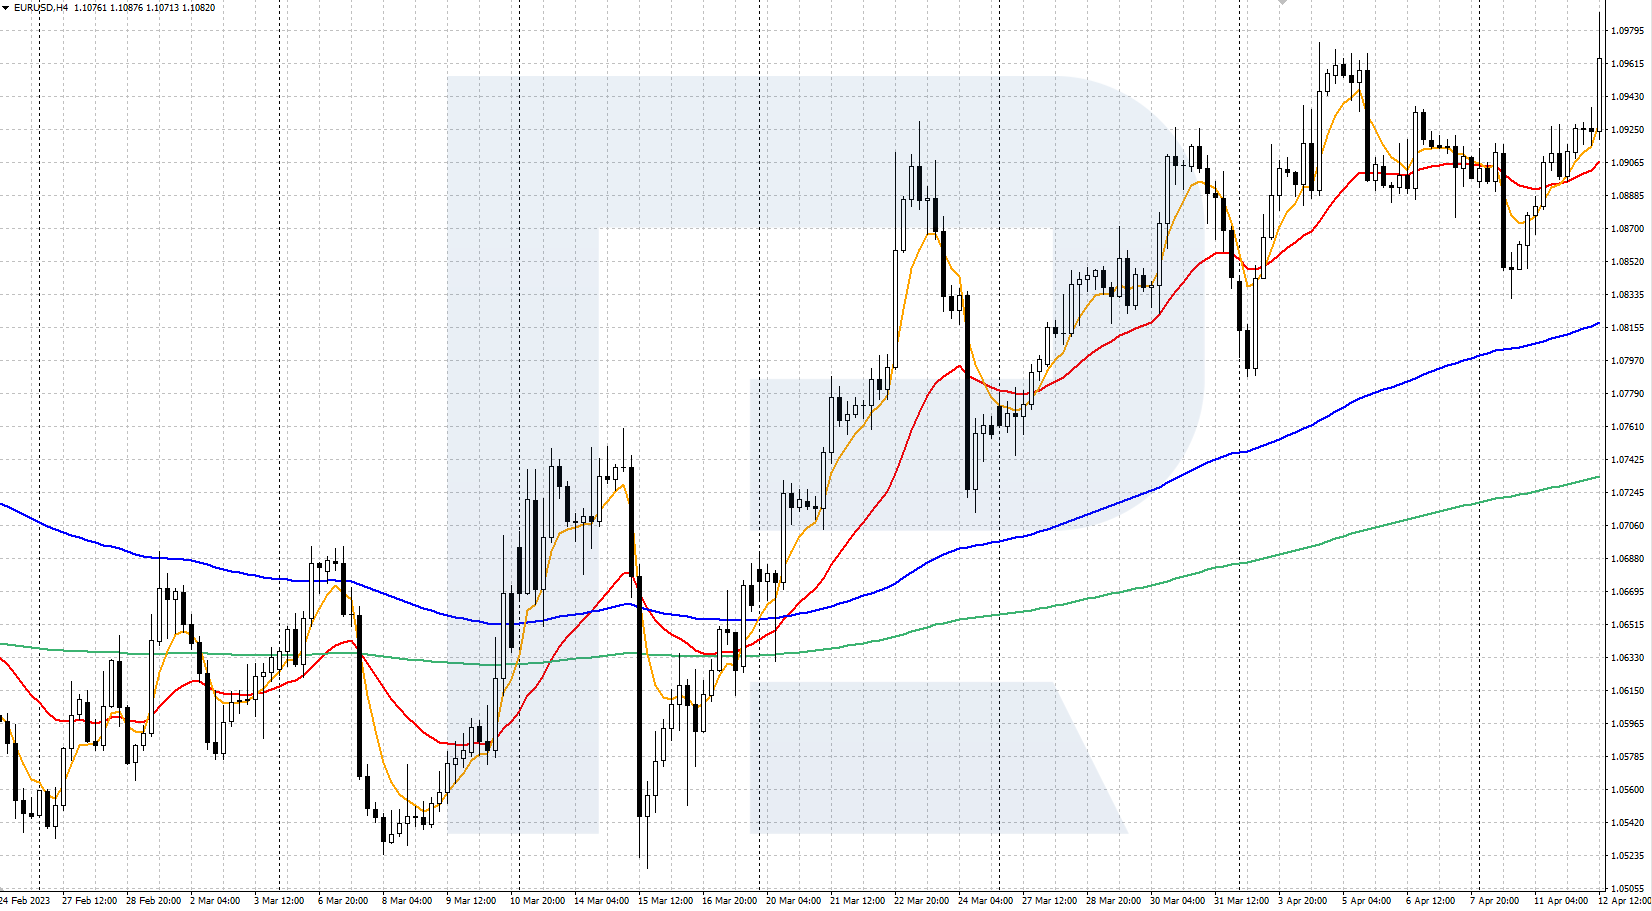
This indicator strategy uses four exponential moving averages (Moving Average, MA) – EMA (6), EMA (25), EMA (150), and EMA (365) – to confirm the trading direction and search for trading signals. This indicator has long been considered a simple and effective tech analysis tool, which helps determine trend movements and support or resistance areas on the price chart.
The name “Base 150” comes from the first version of the strategy, which used only one slow-moving average EMA (150). This trading approach was later improved to include one more moving average EMA (365), but the name remained unchanged. In this strategy, the Moving Averages not only serve as trend indicators but also as dynamic support/resistance levels, which are used to conduct trades.
How the “Base 150” strategy works:
- To find buy signals for a financial instrument, the quotes should rise above the slow EMA (150) and EMA (365), thereby confirming the uptrend. Next, the trader needs to wait for a downward correction until the price first touches one of the four moving averages, followed by an uptrend reversal – this will be a signal to buy
- To find sell signals for a financial instrument, the quotes should settle below the slow EMA (150) and EMA (365), thus confirming the downtrend. Then the trader needs to wait for an upward correction until the price first touches one of the four moving averages, followed by a downward reversal – this will be a signal to sell
The “Base 150” strategy is primarily aimed at trading the EUR/USD, GBP/USD, USD/CHF, and USD/JPY currency pairs. However, it is versatile enough and can be used to trade other financial instruments. The recommended timeframes on the chart are H1, H4, and D1. Trades are made in the direction of the trend after the price rebounds from the Moving Averages. Risk management for this strategy implies that possible losses per trade should not exceed 1% of the deposit.


How to set up the Moving Average indicators
To set up the indicators on the popular trading platforms МetaTrader 4 and МetaTrader 5, follow these steps:
- Open the terminal and log in to your account.
- Select the chart of your desired instrument.
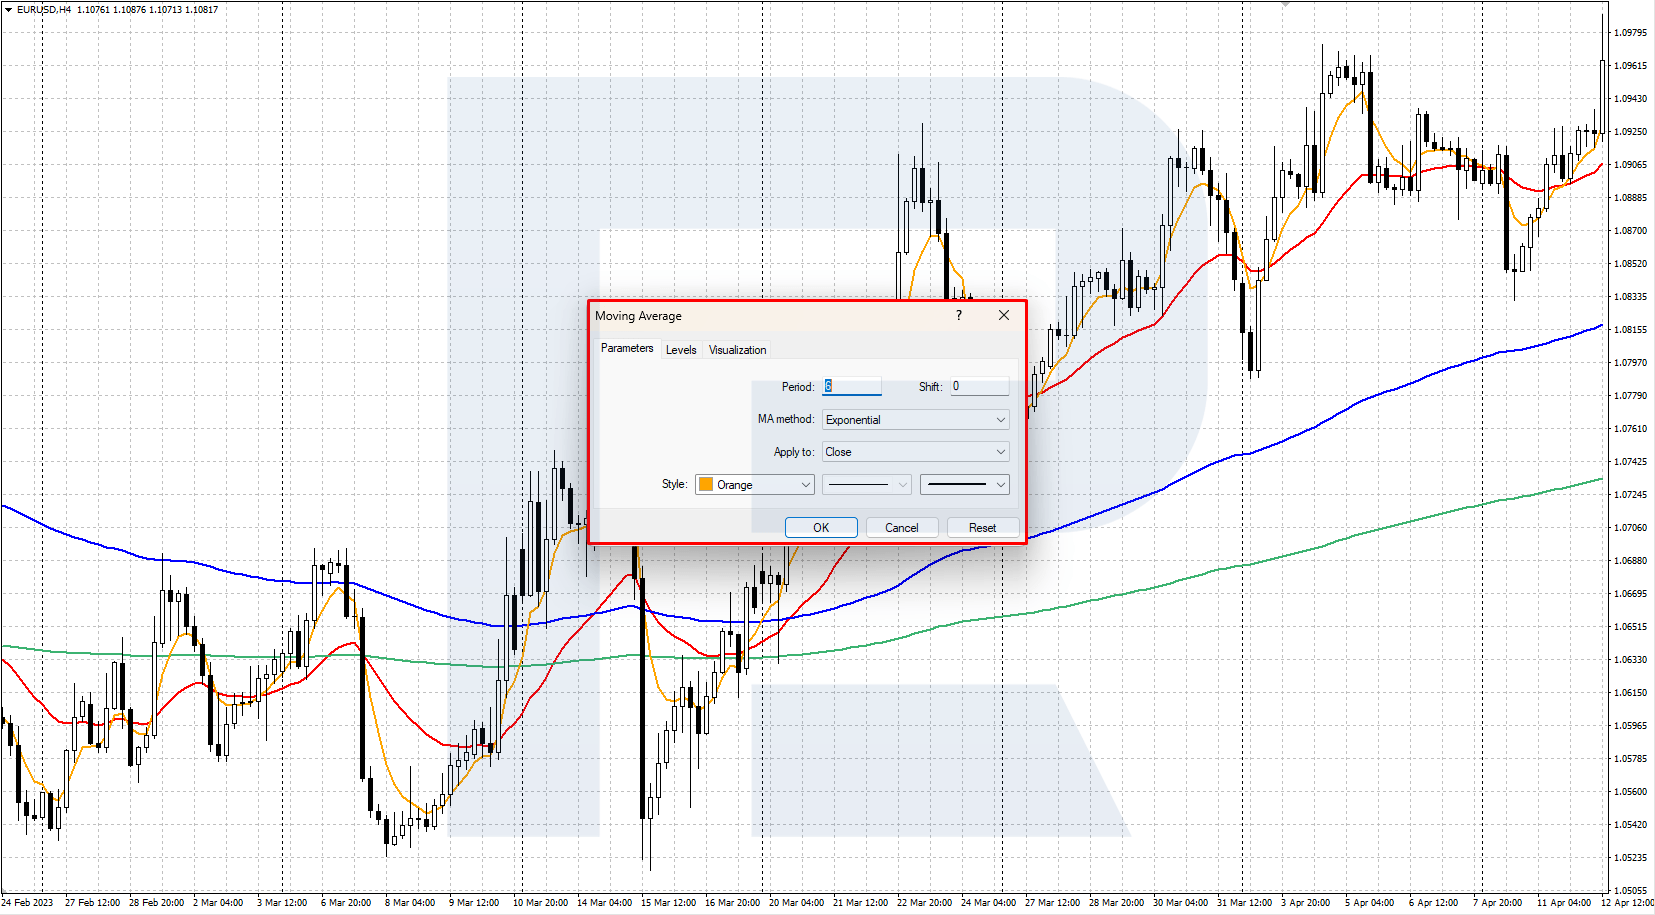
- From the Main Menu, go to – Insert – Indicators – Trend, and then click on Moving Average.
- In the settings window that appears, select period 6, the colour and width of the line, MA method – Exponential. Click OK to apply the parameters and close the settings window.
- Repeat the actions above for the other three moving averages. In the settings window that appears, select the periods 25, 150, and 365, the colour and width of the line, MA method – Exponential. Click OK to apply the parameters and close the settings window.
As a result, the chart will show four Moving Averages – EMA (6), EMA (25), EMA (150), and EMA (365).
How to buy with the “Base 150” strategy
- The market is in an uptrend, with the quotes and fast-moving averages EMA (6) and EMA (25) rising above the slow-moving averages EMA (150) and EMA (365)
- The trader waits for a downward correction until the price first touches any of these moving averages, followed by an upward price reversal. Further touches should be ignored as the trade is to be opened only after the very first touch
- For a more accurate entry when the price touches the moving average, a lower timeframe (e.g. H1 for H4 or H4 for D1) can be used to trace how quotes reverse upwards
- In case of an upward reversal, a buy position is opened. If there is no reversal, the signal is ignored, and the trader waits for other moving averages to be touched
- Stop Loss is set just below the local low formed by the correction. The expected Take Profit should be twice the Stop Loss amount
Example of a buy using the “Base 150” strategy
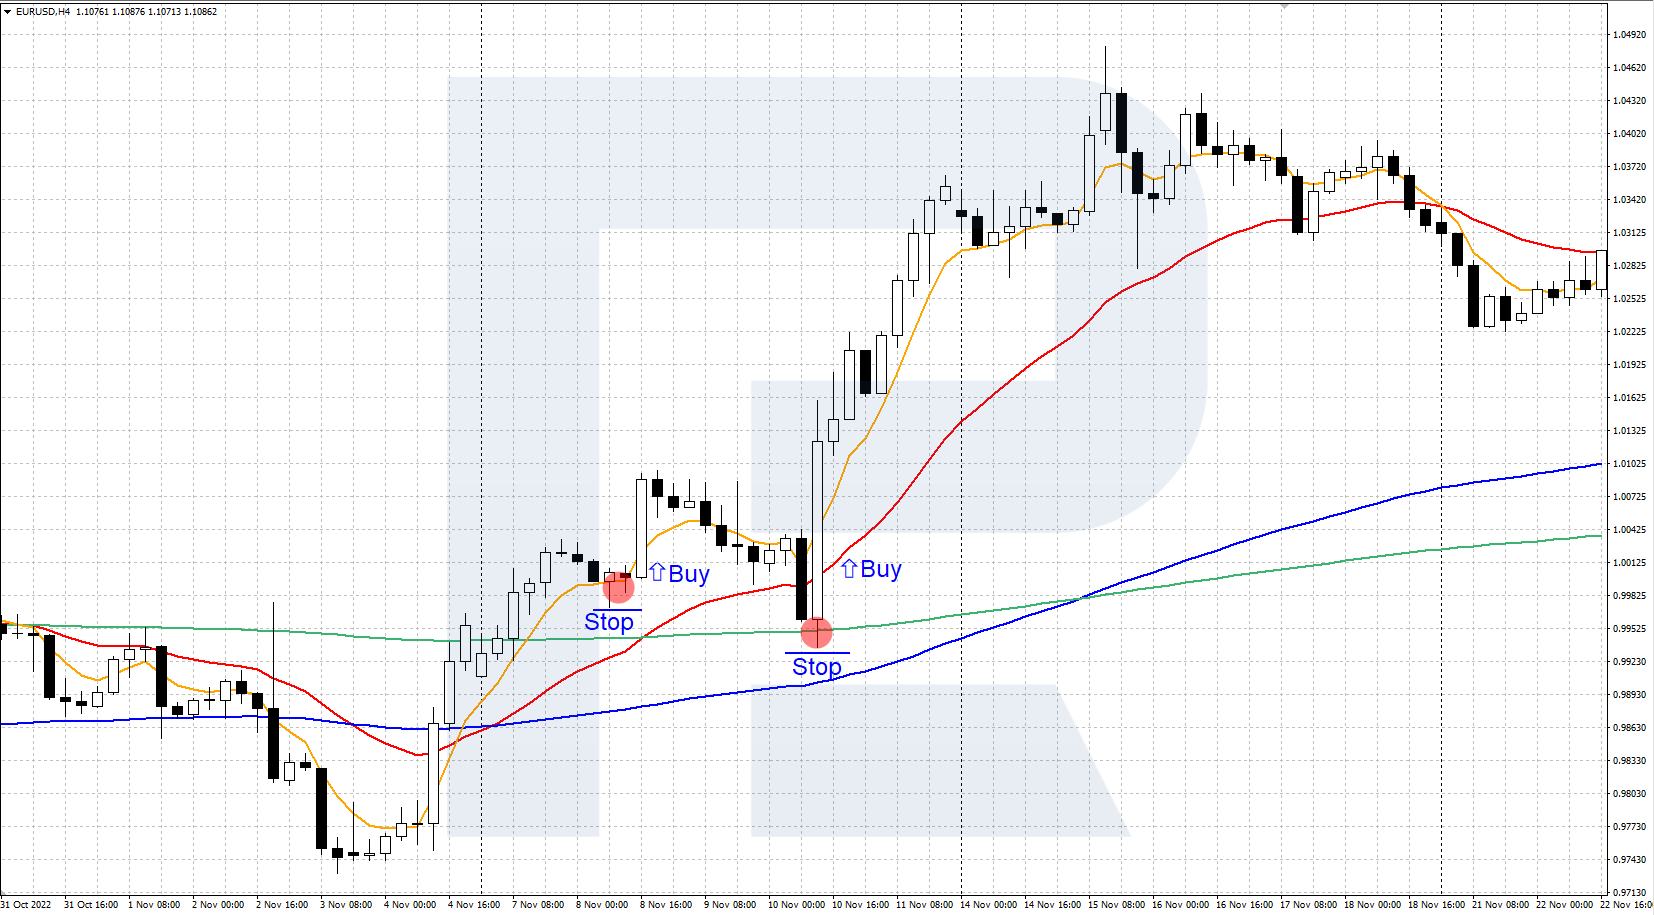
- The H4 chart of the EUR/USD currency pair showed an uptrend, with the quotes and fast-moving averages EMA (6) and EMA (25) rising above the slow-moving averages EMA (150) and EMA (365)
- On 8 November 2022, following a downward correction, the quotes touched the orange EMA (6) for the first time
- On the lower H1 timeframe, the trader waited for an uptrend reversal and opened a buy position
- The buy position was opened at the price of 1.00100, Stop Loss was set at 0.99700, below the low of the correction, and Take Profit was set at 1.00900
- Later, there was one more upside rebound, but from the green EMA (365)


How to sell with the “Base 150” strategy
- The market is in a downtrend, with the quotes and fast-moving averages EMA (6) and EMA (25) falling below the slow-moving averages EMA (150) and EMA (365)
- The trader waits for an upward correction until the price first touches any of these moving averages, followed by a price reversal downwards
- For a more accurate entry when the price touches the MA, a lower timeframe (e.g. M15 for H1 or H1 for H4) can be used to trace how quotes reverse downwards
- In case of a downward reversal, a sell position is opened. If there is no reversal, the signal is ignored, and the trader waits for the first touch of other MAs
- Stop Loss is set just above the local high formed by the correction. The expected Take Profit should be twice as much as the Stop Loss amount
Example of a sell using the “Base 150” strategy
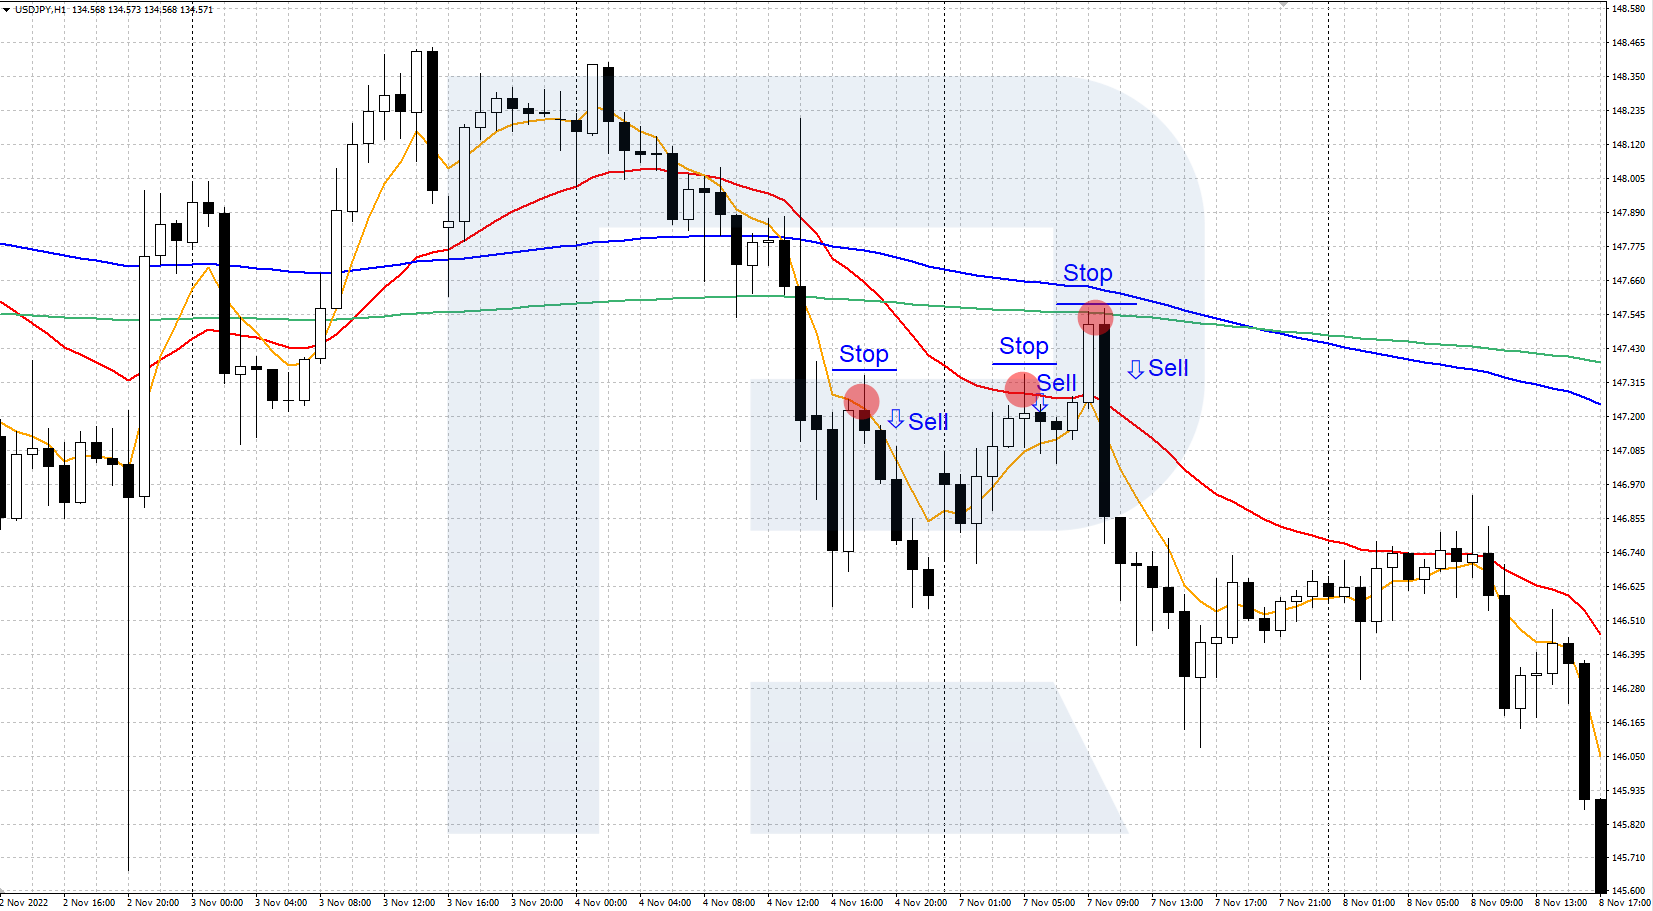
- The H1 chart of the USD/JPY currency pair showed a downtrend, with the quotes and fast-moving averages EMA (6) and EMA (25) falling below the slow-moving averages EMA (150) and EMA (365)
- On 4 November 2022, following an upward correction, the quotes touched the orange EMA (6) for the first time
- On the lower M15 timeframe, the trader waited for a downtrend reversal and opened a sell position
- The sell position was opened at the price of 147.100, Stop Loss was set at 147.350, above the high of the correction, and Take Profit was set at 146.600
- Later, there were two more downward rebounds from the red EMA (25) and the green EMA (365)
Summary
The “Base 150” strategy is a simple indicator trading system based on the signals of four Exponential Moving Averages with various periods. The system works successfully during a trend on local corrections, but it is best not to use it during a flat market. For more reliability, we recommend using the strategy in combination with classical technical analysis tools. Make sure to test the strategy on a demo account before using it.


