Simple Crude Oil Trading Strategy

6 minutes for reading
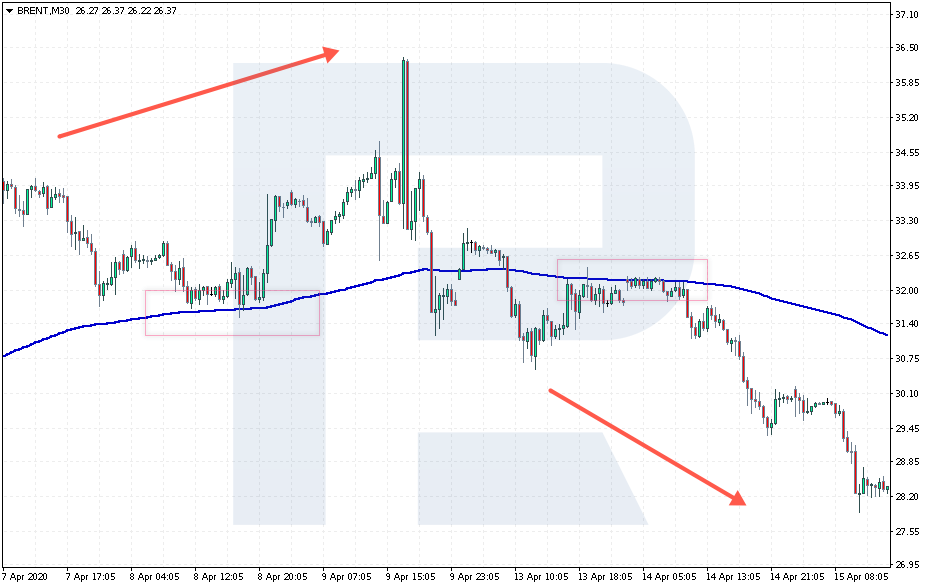
Crude oil is a trend instrument, which means it demonstrates directed movements up or downwards rather frequently. Most beginners avoid trading oil because it looks complicated due to increased volatility.
Indeed, in times of crises, the oil may demonstrate unbelievable movements. A good example would be the recent decline of the WTI futures for May to 0, which, of course, managed to shock even experienced traders. On the other hand, trading the trend is more correct than looking constantly for reversals.
Today, we will discuss a simple strategy for trading oil. It is meant for H1 and M30, which allows receiving a quicker result and placing smaller Stop Losses than on D1 or H4.
What indicators do we need to trade oil?
Any strategy must include several indicators. It would be perfect to use both a trend indicator and an oscillator. Hence, we will use two indicators: the Moving Average and Stochastic Oscillator.
The Moving Average for finding the trend
The first indicator is the Moving Average, a trend indicator. It will let us know what trend there is on the market. A lot of trading strategies are based on the Moving Average.
As a rule, market players trade bounces off and breakaways of the MA; some just define the trend direction. If the price is above the MA, the trend is ascending, and we look for an entry point to a buying trade.
If the price has broken away the MA from above, the trend has changed to a descending one; in this situation, you might try to sell. This way, we will trade the prevailing trend, which is advisable, especially for a market beginner.
The difficult thing is to choose the period for the indicator. If the price keeps breaking away your indicator line, you need to make the period longer. The period is considered to be chosen right if the price, after a trend reversal, tests the broken indicator line and bounces off it. In this case, we might call the indicator line some sort of support or resistance.
In our strategy, we will use an Exponential MA with period 185. However, you may experiment with the period.
The Stochastic Oscillator for finding an entry point
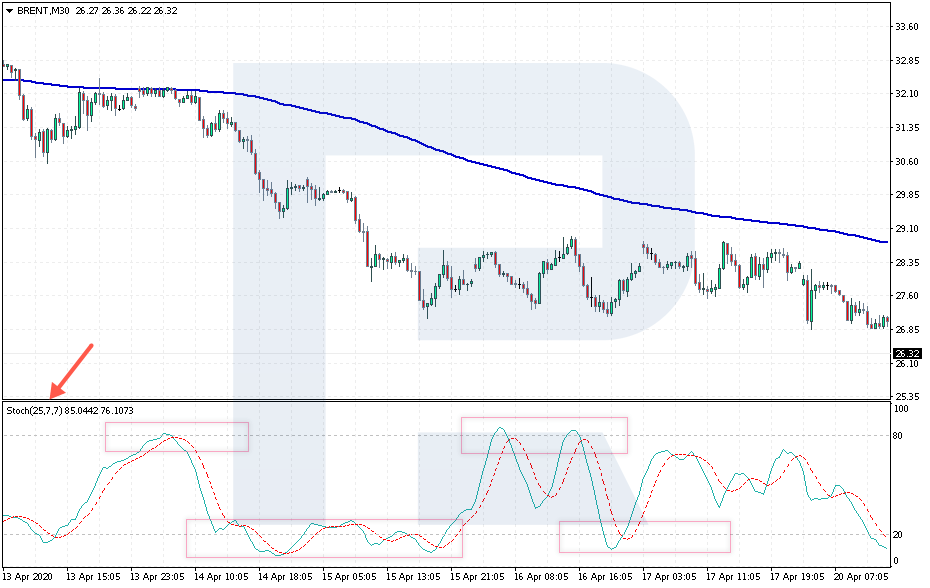
The second indicator is the Stochastic Oscillator: the crossing of its lines will show where to buy and where to sell oil. The idea of the oscillator is to show how much the price has deviated from the average. For this strategy, the following parameters of the indicator are very important: 25, 7, 7. They will slow down the instrument, helping to avoid false signals.
If the trend is descending, and we are seeing strong price growth, while the Stochastic indicates the overbought state of the market - this is the moment to enter the market, as the trend will, most likely, continue. All we need is to wait for the signal lines on the Stochastic to cross and open the trade.
How to open a buying trade by the strategy?
To receive a signal to buy oil, the price must be above the MA level. Then wait for the development of a downtrend and since that moment start waiting for a signal to buy from the Stochastic.
The parameters for entering a buying trade are as follows:
- The price is above the EMA with period 185, which indicates an uptrend.
- The signal lines of the Stochastic Oscillator with period 25, 7, 7 have fallen below 20 and crossed.
- Enter the buying trade after the candlestick closes to see the crossing of the Stochastic lines clearly.
Let us have a look at an example of such a trade. As we may see, the price, having broken away the MA from below, is correcting and beginning to decline. The Stochastic values are also declining.
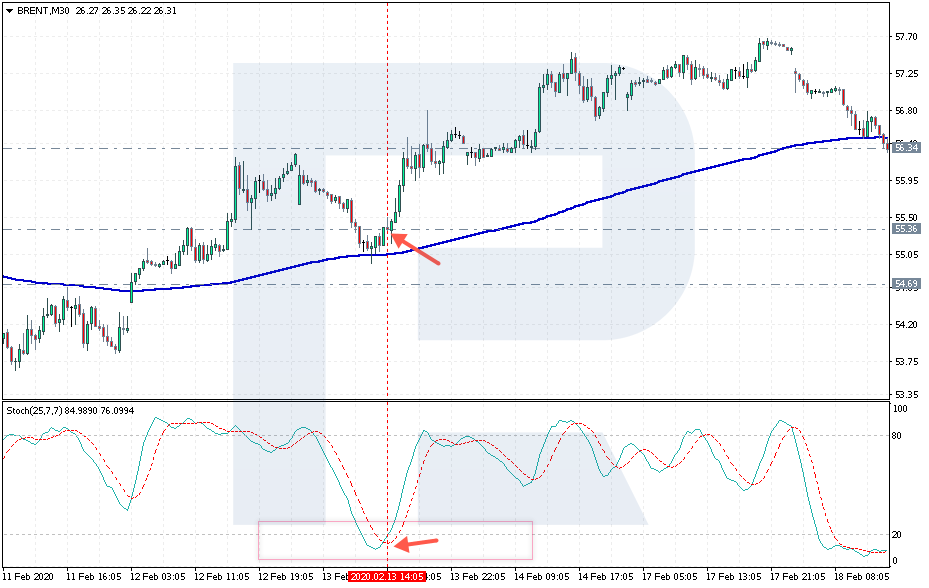
Then the broken MA is tested, while the oscillator values fall below 20, indicating the oversold state of the market.
We must wait for the indicator lines to cross. As soon as it happens and the candlestick closes, we may open a trade at the price of $55.14.
Where to place the Stop Loss and Take Profit?
An Stop Loss is placed under the MA line at $54.65. A Take Profit is at the nearest resistance line of $56.35.
Another option is to exit the market when the Stochastic gives the opposite signal. The third option of closing the trade is to use Trailing Stop: in this case, we may let the profit grow and not to hurry to exit the market.
How to open a selling trade by the strategy?
To receive a signal to sell oil, make sure that the price is below the MA: this means a downtrend. Then wait for the price to correct to the level of the MA and for the Stochastic lines to cross above 80.
The parameters for entering a selling trade are as follows:
- The price is below the MA with period 185, indicating a downtrend.
- The signal lines of the Stochastic have risen above 80 and crossed.
- Enter the buying trade after the candlestick closes to see the crossing of the Stochastic lines clearly.
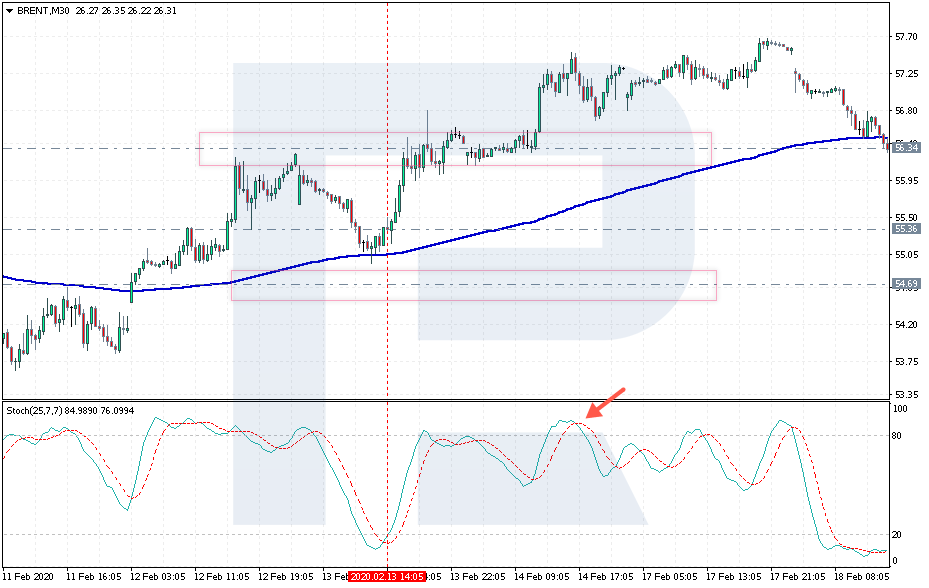
Again, let us have a look at an example. A selling trade follows right after buying one. The price has slumped below the MA with period 185. After an ascending correction develops, the signal lines of the oscillator cross. Note that the values are above 80. After the candlestick closes, we may open a selling trade at the price of $55.65.
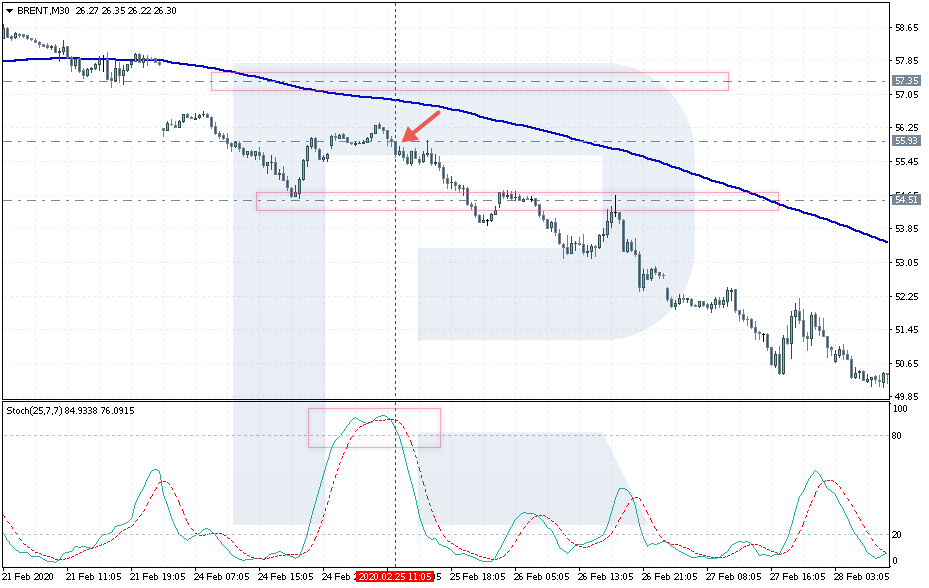
An SL, in this case, is placed at $57.35. A TP is at the support level of $54.50; alternatively, wait for the opposite signal from the Stochastic. In our example, the price has gone deep down, which could bring a good profit.
Closing thoughts
We have discussed a very simple strategy for trading oil. It features clear rules for entering and exiting the market. Its advantage is that we trade the trend, as long as the oil chart is prone to trend movements: the beginner will easily stay on the right side of the market. Thanks to working on small timeframes, the SL will be much smaller, hence the risk of a loss will be minimal.
The strategy may be recommended to beginners who are just getting acquainted with financial markets as well as to experts who are starting to trade oil.