Trading by Forex Racer Strategy on Renko Charts

8 minutes for reading
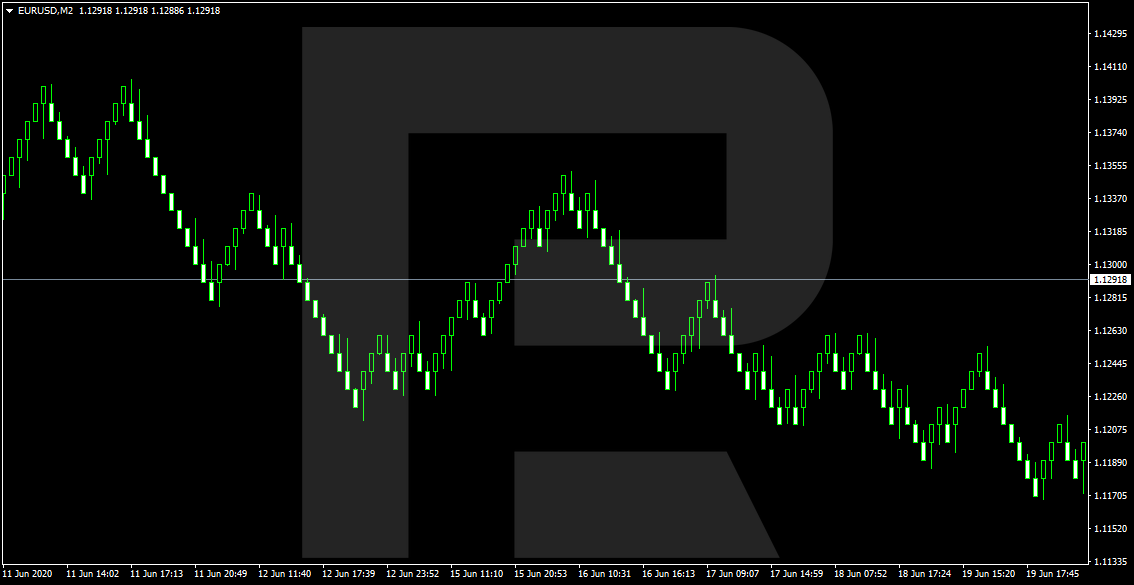
Today, I will tell you about Forex Racer trading strategy for the Renko charts. This type of chart is much less popular among traders than bar or candlestick charts; however, some say that it is most clear of noises, which helps traders make better trading decisions.
The chart consists of Bricks of the same size; as soon as the price movement exceeds 10 points, a new Brick appears. The chart does not account for the time factor.
Naturally, trading such charts requires special systems that differ completely from traditional ones. The Forex Racer strategy is designed exactly for this type of chart, and traders say it gives good opportunities for active trading.
Characteristics of Forex Racer strategy
The Forex Racer trading strategy applies to any currency pairs but works better on more trendy pairs. For example, EUR/GBP should be excluded from trading as trend movements are rare here. Classic pairs, such as EUR/USD and GBP/USD, and more volatile ones, such as GBP/JPY, will suit perfectly.
You may choose any timeframe: as you remember, Renko charts are not time-bound.
The Forex Racer strategy better shows itself during active trading sessions, such as the European and American ones. Less volatile sessions, in this case, should be skipped: for this strategy, we prefer good powerful movements instead of flats, like, say, in the Sniper strategy.
Essential Indicators for Forex Racer strategy
The strategy implies using a lot of indicators. As in any other strategy, the combination of the indicators gives good entry and exit points.
You can download all these indicators in the bottom of the article. Let us enumerate the indicators.
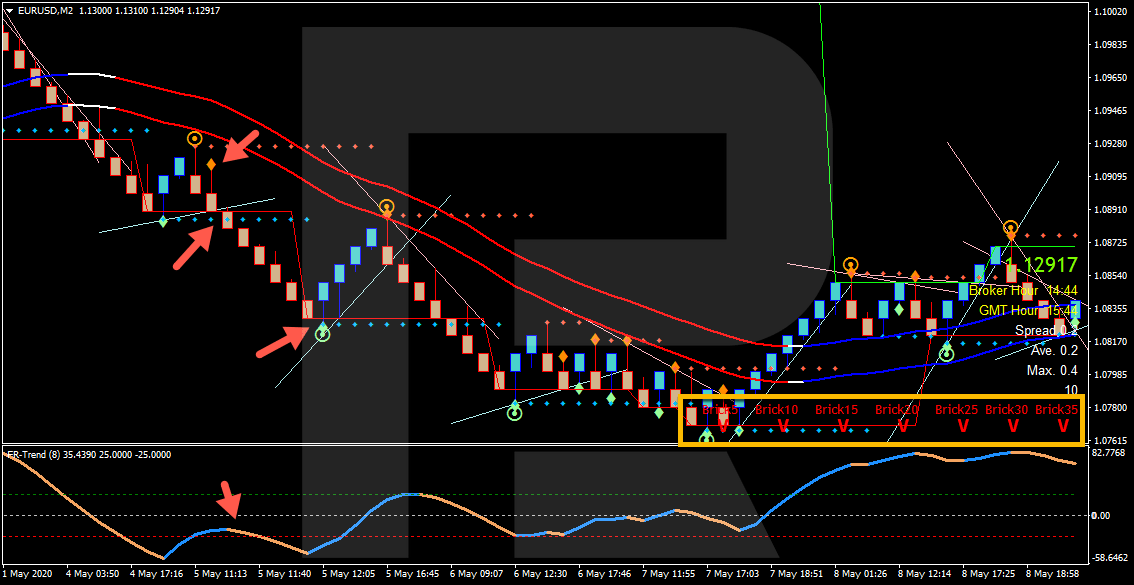
FR Scanner indicator
The FR Scanner indicator shows the direction of price movements on smaller and larger Renko charts. Brick 5 is the smallest timeframe, while Brick 35 is the trend on a larger timeframe. In other words, this indicator shows the trend on different timeframes. If on all the timeframes it indicates a downtrend, the price is also likely to go on falling. This indicator also acts as a filter and signals to look for entry points.
TrendLines indicator
On the chart, the TrendLines indicator looks like two lines, very similar to Moving Averages or Envelopes indicator. The lines change their color depending on the market trend: if it is ascending, the lines will be blue, while in a downtrend, the lines turn red.
Note that when the price is above the TrendLine lines, the trend will most often be ascending; hence, the indicator lines will be blue. Conversely, if the price is below the indicator, the trend, in most cases, will be descending, and the lines will be red.
BreakOut indicator
On the chart, the BreakOut indicator looks like a dotted line, either blue or orange. These lines are used for finding entry points and placing Stop Losses.
SupportResistance indicator
The SupportResistance indicator shows dynamic support and resistance levels. They form a channel that follows the price so that the levels change constantly. The resistance line is colored light-green while the support line is red.
Retracement indicator
The Retracement indicator looks like a line following the price, similar to the trendline from classical tech analysis. The purpose of the indicator is to represent corrections on the chart; however, many traders admit that it does not work too well. On the other hand, it may help to find an entry point or place a Stop Loss.
ReversalPoints indicator
On the chart, the ReversalPoints indicator looks like a green or orange circle with a point inside. It is used not directly for trading but for understanding the current situation better.
FR Signals indicator
On the chart, the FR Signals indicator looks like green or orange rhombuses. It is used among other criteria for entering the market: if a rhombus has formed above a candlestick, it signals to sell; and vice versa, if it is under the candlestick, start buying.
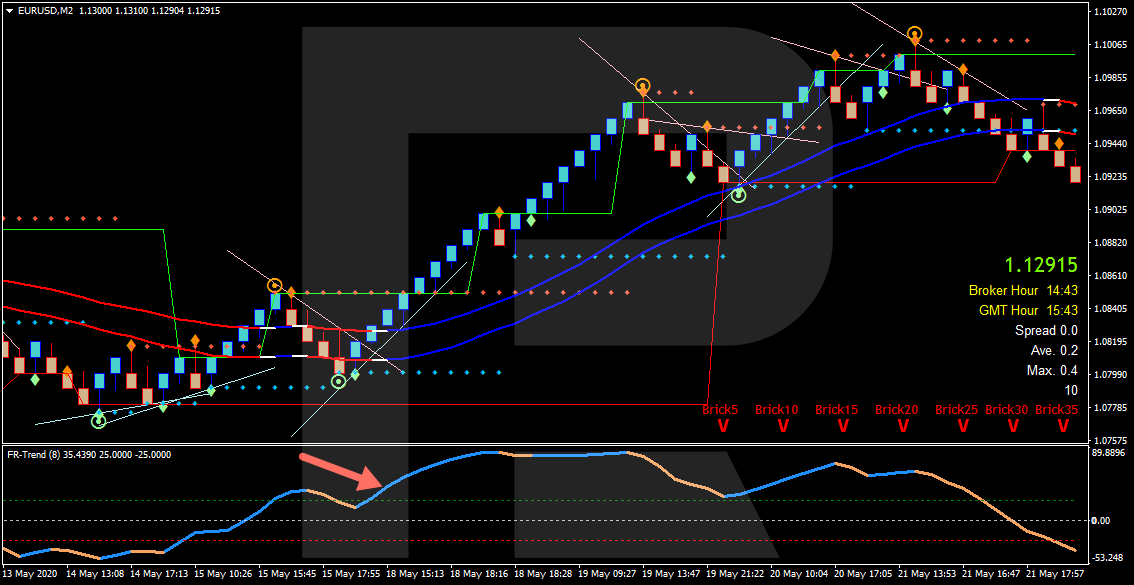
FR Trend indicator
The FR Trend indicator is placed under the price chart and indicates the current market trend. It is used for Renko charts only and as a separate filter for entering the market. If the indicator line has turned blue, look for signals to buy; an orange line advises to sell.
How to open a selling trade by Forex Racer?
For a signal to sell to be considered valid, it must meet the following requirements:
- The TrendLines indicator is red, indicating a downtrend. Keep in mind, that the color will most often be red when the price is under the indicator lines.
- An orange rhombus has formed on FR Signals. As I have mentioned above, this is one of the main criteria for entering the market.
- FR Trend has turned orange, indicating a descending impulse.
- All the Bricks of FR Scanner are red, indicating a descending impulse on all timeframes.
- Open your position by a pending order Sell Stop below the lines of TrendLines, BreakOut, Retracement, or SupportResistance.

- In this case, place the Stop Loss above the nearest line of indicators: TrendLines, BreakOut, Retracement, or SupportResistance. Alternatively, place it no farther than 50 points away from the entry point, if you cannot use the signals of the indicators at the moment of entering the trade.
- Exit the position when a green rhombus of FR Signals forms under the candlestick, forming a signal to buy. The second signal to close the trade will be FR Trade turning blue. As soon as the Brick-candlestick of the Renko chart closes and a new one appears, exit the position.
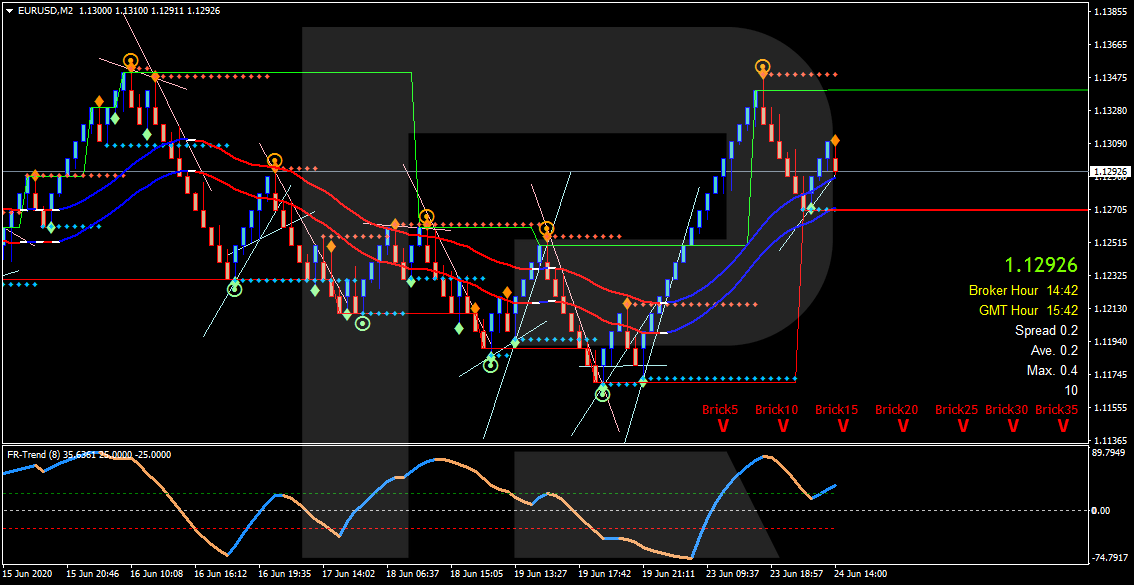
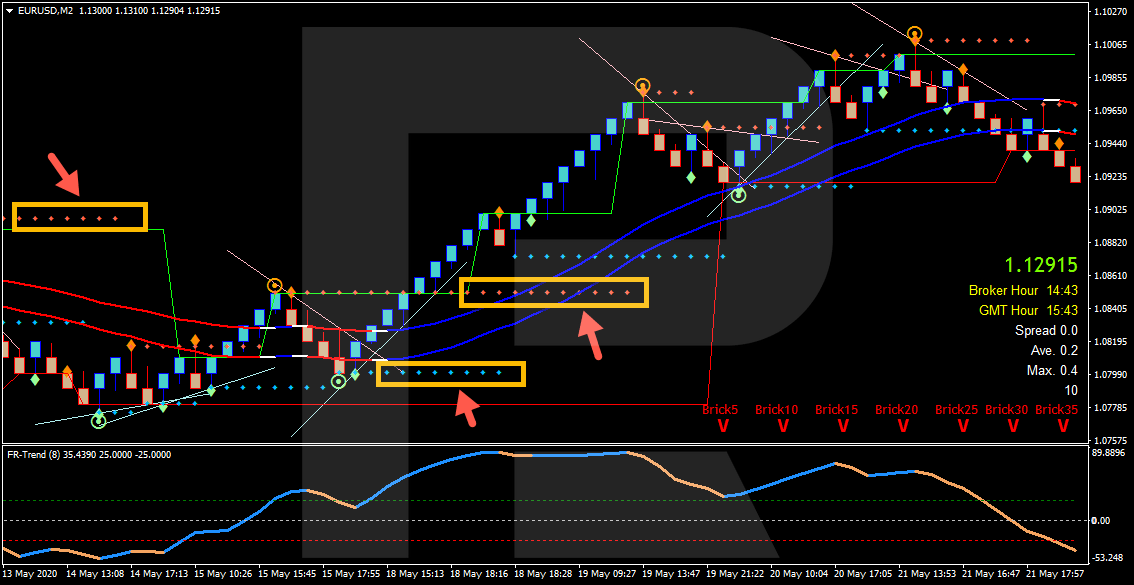
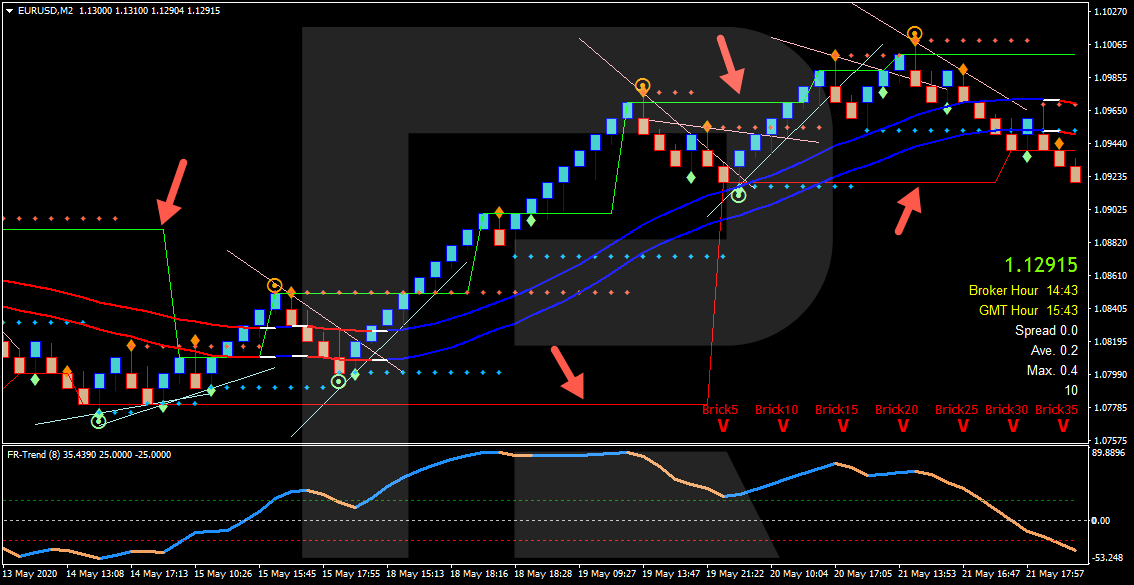
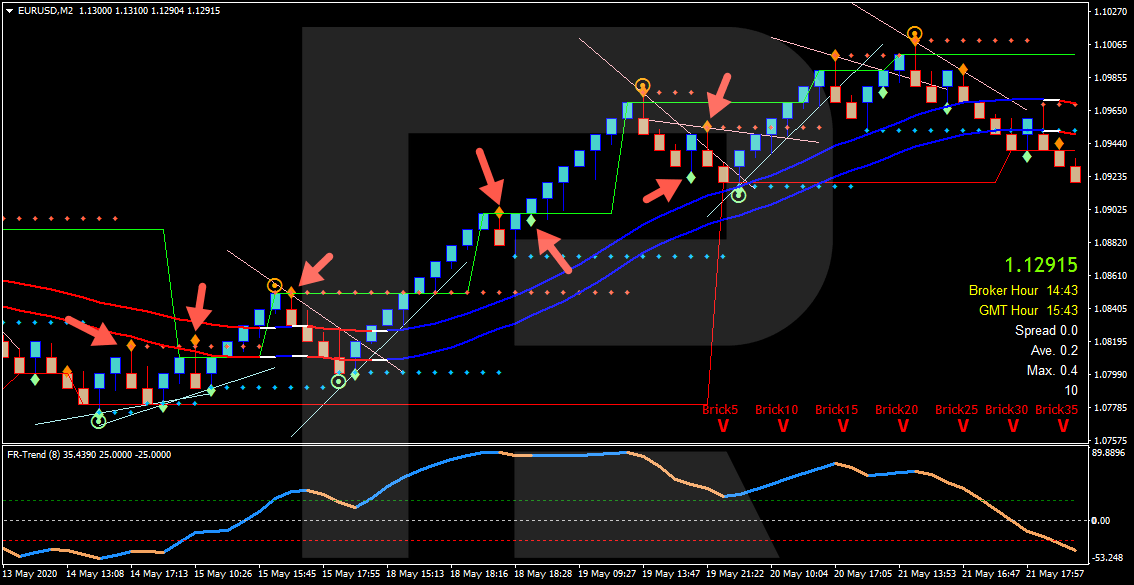
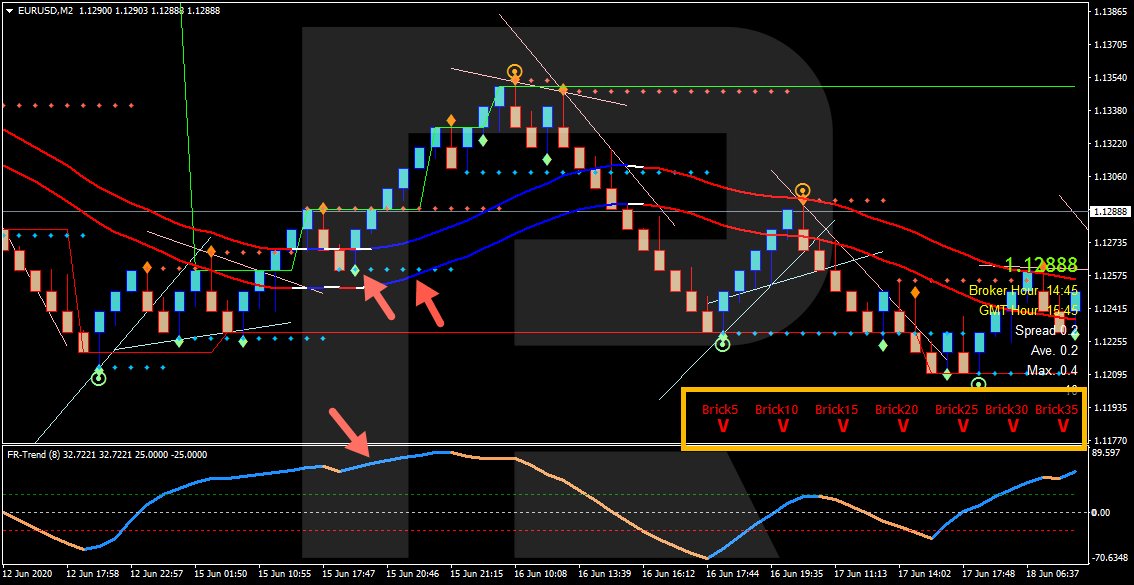
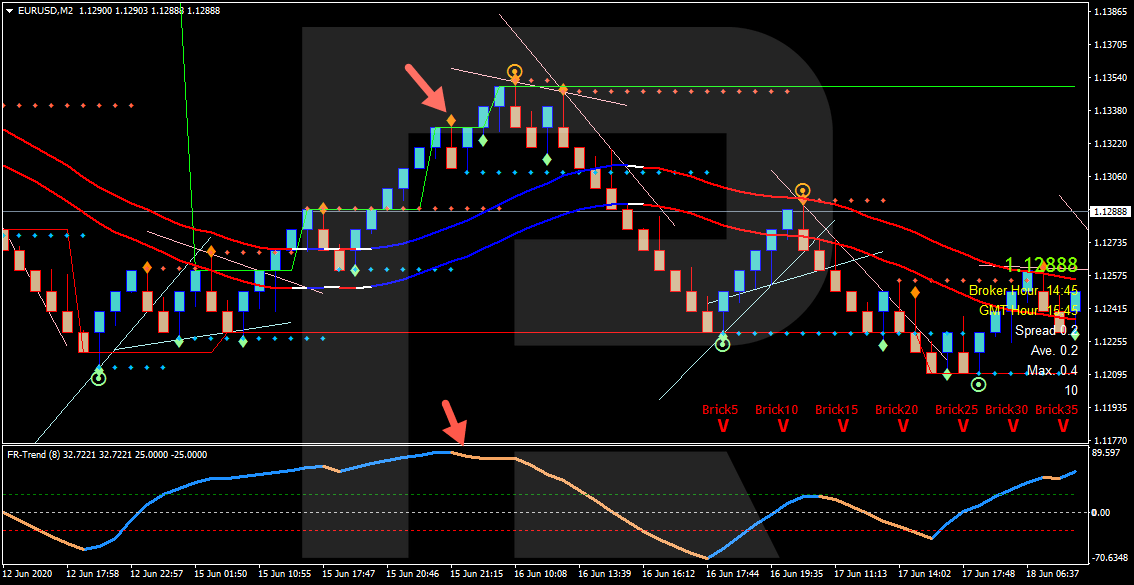
An example of a selling trade
Have a look at an example of a sale of the EUR/USD pair. We can see an orange rhombus under the candlestick. TrendLines is also red, while FR Trend is orange. Keep in mind that all signals of FR Scanner must be red.
Now we may place a pending Sell Stop several points below the level of BreakOut. The SL, in this case, must be above BreakOut. Our profits rose slightly above 40 points.
How to open a buying trade by Forex Racer?
For a signal to buy to form correctly, the rules will be opposite to those for a selling trade:
- The TrendLines indicator is blue, indicating an uptrend. Keep in mind, that the color will most often be blue when the price is above the indicator lines, hinting on a bullish impulse.
- A green rhombus has formed on FR Signals under the candlestick of the chart.
- FR Trend has turned blue, indicating an ascending impulse.
- All the Bricks of FR Scanner are green, indicating an ascending impulse on all timeframes, which is another important signal in favor of the trade.
- Open your position by a pending order Buy Stop above the lines of TrendLines, BreakOut, Retracement, or SupportResistance.
- In this case, place the Stop Loss below the nearest line of indicators: TrendLines, BreakOut, Retracement, or SupportResistance. Alternatively, place it no farther than 50 points away from the entry point, if you cannot use the signals of the indicators at the moment of entering the trade.
- Exit the position when an orange rhombus of FR Signals forms above the candlestick, forming a signal to sell. The second signal to close the trade will be FR Trade turning orange. As soon as the Brick-candlestick of the Renko chart closes and a new one appears, exit the position. Always wait for the Brick to close.
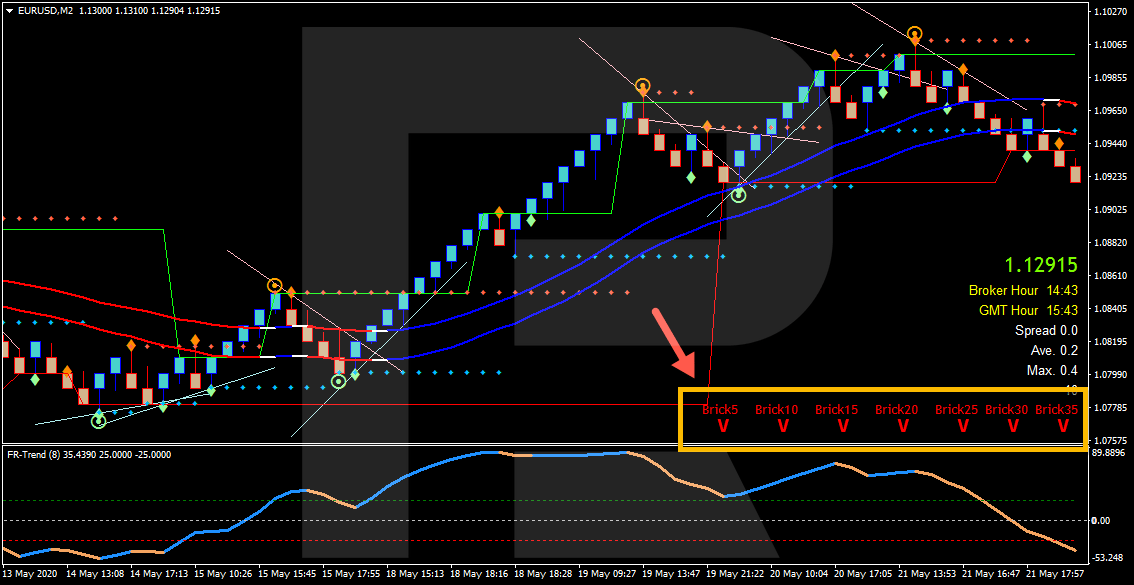
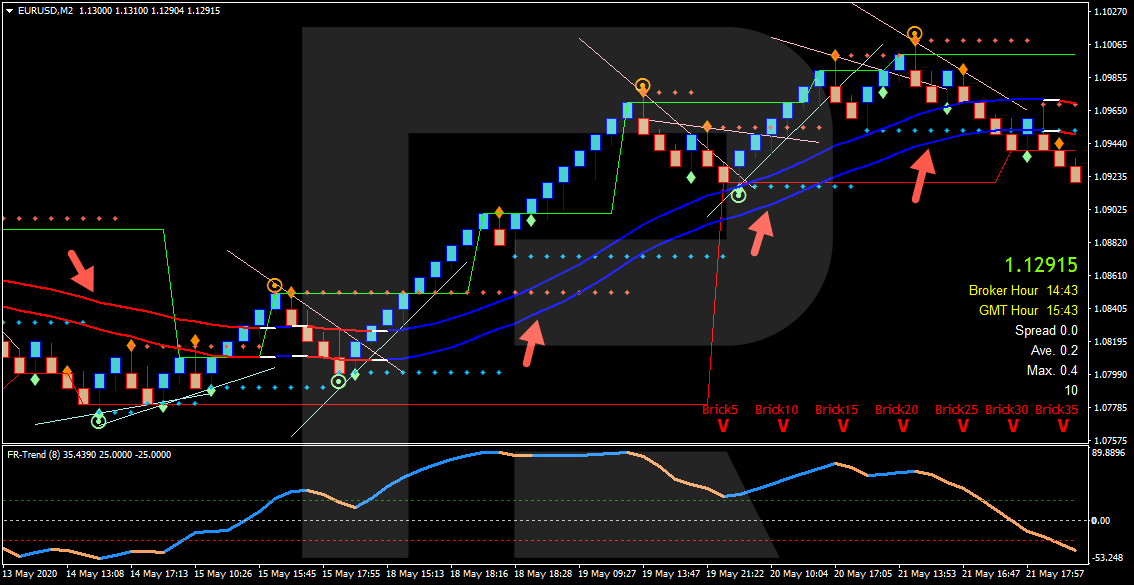
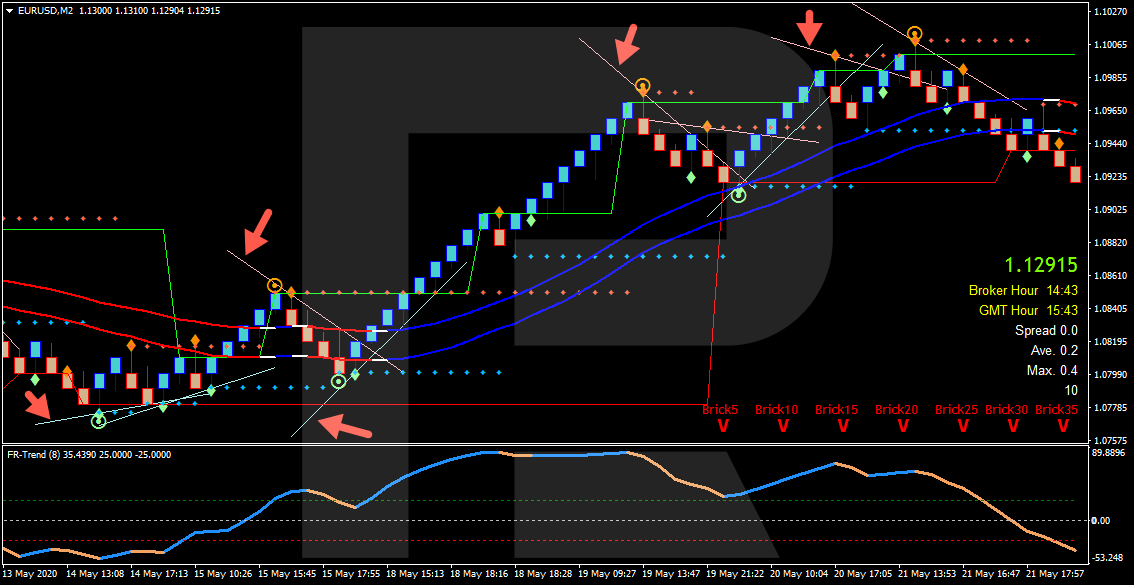
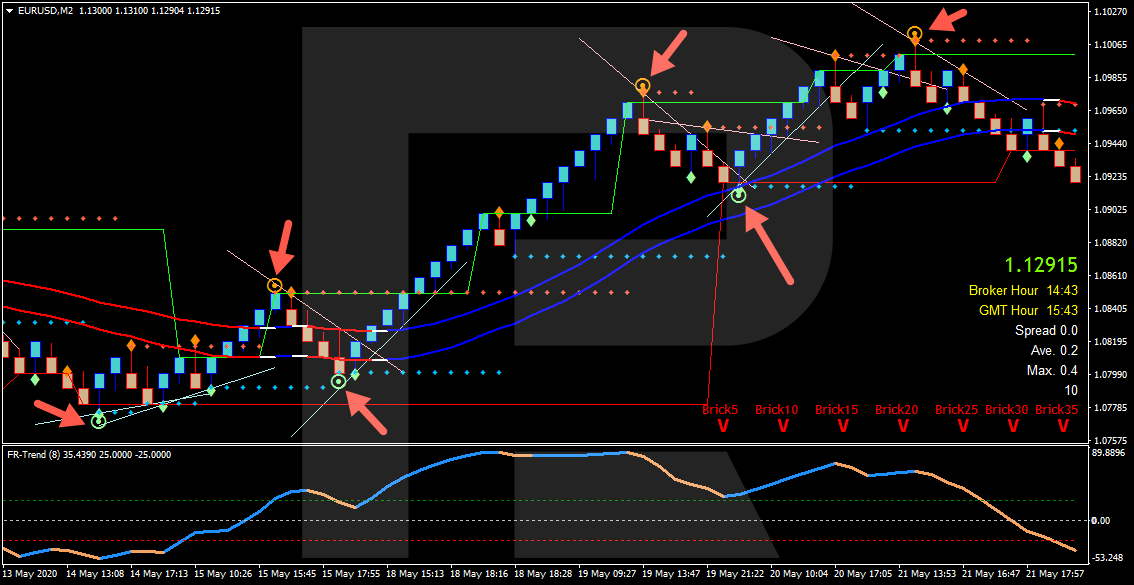
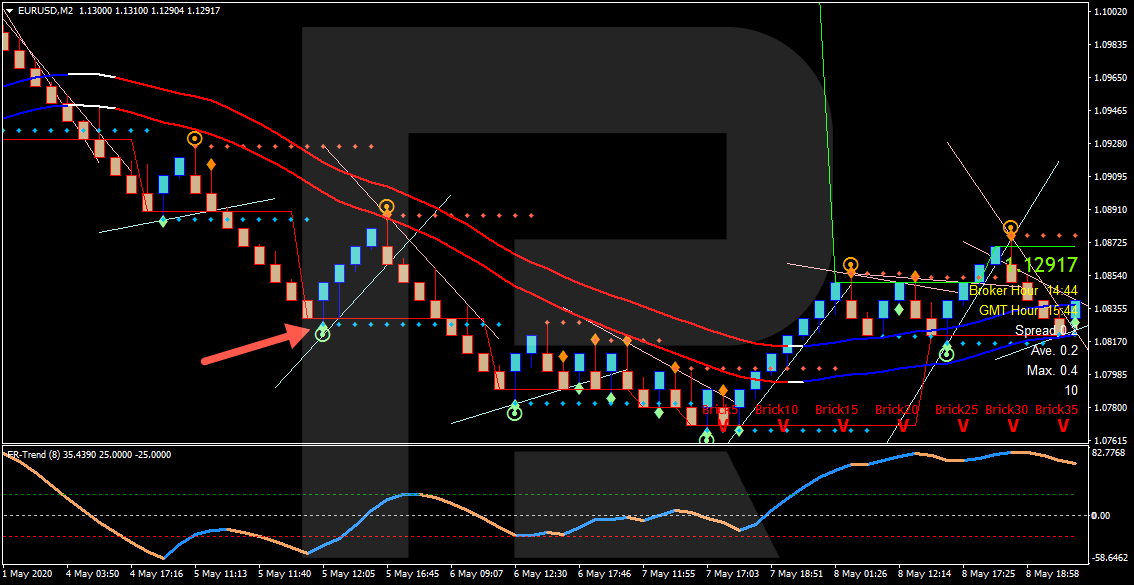
An example of a buying trade
Have a look at an example of a buying trade, also on EUR/USD. We can see a green rhombus above the candlestick. TrendLines is colored blue, while FR Trend has also turned blue. All the signals of FR Scanner are green.
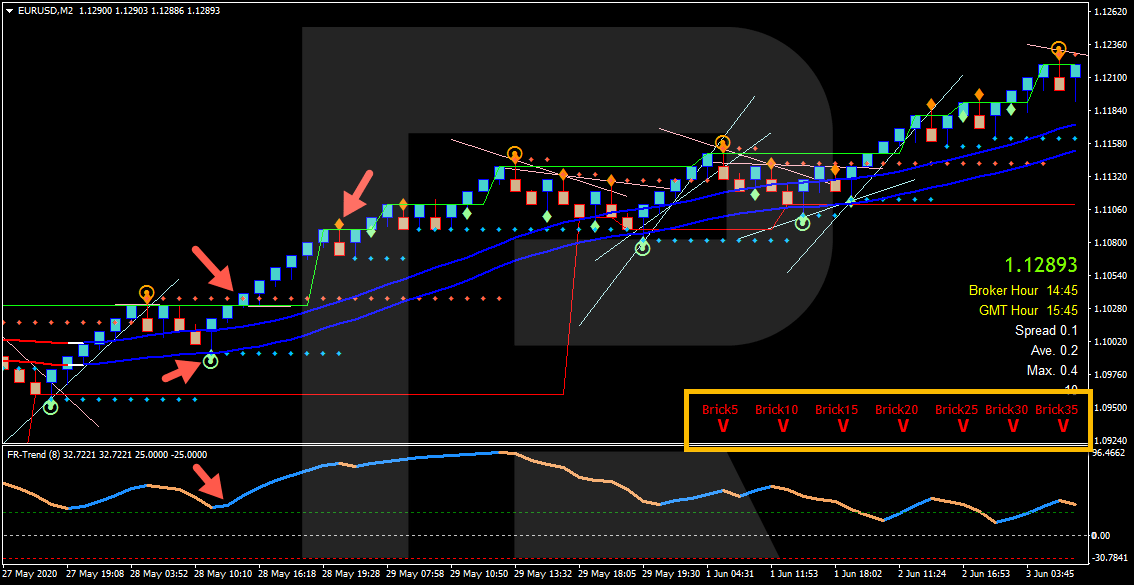
Place a Buy Stop pending order several points above the TrendLines level. The SL, in this case, is below SupportResistance, it amounts to 20 points. The profit, in its turn, amounted to slightly more than 50 points.
Closing thoughts
In terms of the number of indicators, this strategy resembles Victory or Fishing. On the whole, its rules of entering the market by the trend are simple and clear, especially as we do it when the price on all the timeframes goes in the same direction. For example, if the trend is ascending everywhere, we only buy; if it is descending, we only sell. This is a great advantage of the strategy.
In the long run, any trend strategy will yield much more profit than graphic patterns alone or any counter-trend system. Another advantage of Forex Racer is the opportunity to back-test it as the indicators do not redraft the signals when you open the chart but remain in history.
What may be difficult is mastering the strategy and searching for signals. The indicators, as we know, are multiple, which might discourage a beginner, however, with time they will understand all the peculiarities of the strategy.