How to Trade Nikkei 225 Index?

7 minutes for reading
Nikkei 225 is one of the most important stock indices reflecting the state of the Japanese economy and overall business activity in the country. It is considered one of the oldest indices in Asia. The stock index includes 225 stocks of companies trading directly in the Japanese market. The most famous of them are Sony Corporation, Canon Inc, Nissan Motor Company, and Honda Motor Company.
Curiously enough, the index was named after an economic newspaper that used to calculate the instrument. It was first published as long ago as 1950 and was calculated as the arithmetical mean of the companies’ securities. A company’s weight in the index is calculated based not on the general market capitalization but directly on the stock price. The set of companies in the index is revised every September; in October, changes are accepted.
By the way, RoboForex has just made Nikkei 225 available for trading. Moreover, the company has made trading various indices easier and more attractive by decreasing the minimal lot and step. Average spreads remain among the smallest; for example, an average spread for the De30Cash index is just 0.5 euro per contract.
More information about trading conditions for indices you can find here.
Tech analysis of Nikkei 225

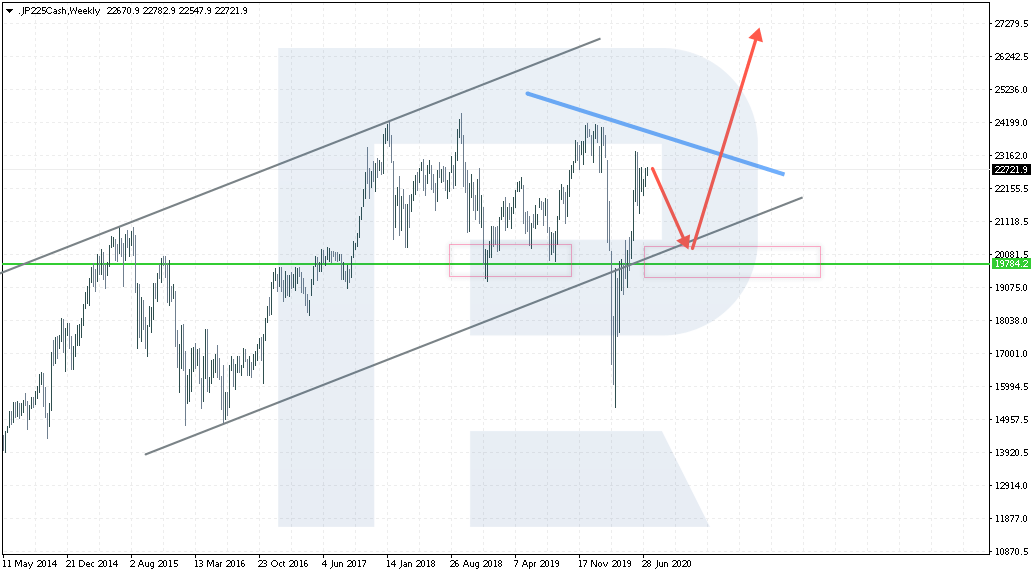
Nikkei 225 differs from other stock indices, such as NASDAQ, Dow Jones, or S&P 500. If other indices are capable of mighty bullish trades and quick restoration after falls, Nikkei 225 had stuck in a wide flat since the beginning of 2017. Only this year, the quotations have dropped below the lower border of the range, almost reaching the level of 2016.
However, the price returned into the channel quite soon, and the quotations are now getting ready for testing an important resistance level at 24200; a breakaway of this level will mean a perspective of further growth.
As for an important support level, it is at 20000. As you may see, upon testing this level upwards, the price tested the support level three times and demonstrated a good bounce upwards.
On the whole, the instrument is quite technical: many levels and patterns work off quite well. Even now, we can single out an inverted Head and Shoulders pattern forming. Inside the pattern, we may expect a decline and test of 20005, where the right shoulder of the pattern will be complete.

As a rule, most traders who use graphic patterns for trading, buy at the right shoulder. The general goal of the growth is 30985. The growth will not happen if 16255 is broken away – this will cancel the pattern and potentially indicate a further decline.
A simple strategy for trading Nikkei 225
Not all traders enjoy using classical tech analysis for trading because it requires constant thinking and drawing different levels and patterns. A significant disadvantage of the analysis is it being subjective: some will think a pattern not regular enough, others will see a Triangle instead of, say, a reversal pattern. Let us have a look at a trading strategy for trading Nikkei 225 that is not subjective.
Which indicators do we need?
After all, we might not say that the instrument demonstrates no trends at all: strong directed movements do happen sometimes. So, let us add Moving Averages for defining the direction of future positions and the Fractals indicator for signaling market entry and placing Stop Losses. The timeframe used is M30.
Strategy parameters
We have chosen several indicators. Now, let us decide which parameters we want to change for the strategy to work with the index.
- Exponential Moving Average (EMA) with period 25 is a fast MA that will be the closest to the price.
- EMA with period 195 is a slow MA that is much farther from the price.
- Fractals settings are standard, forms as a Triangle under a chart candlestick.
How to open a buying trade for Nikkei 225?
For a buying signal to form, the following conditions are to be present:
- EMA 25 has just broken EMA 195 from below and now rests above it. This also indicates the beginning of a bullish trend.
- Fractals has formed above the candlesticks.
- Place a pending Buy Stop order 2-5 points above the Fractals.
- Place a Stop Loss behind the nearest descending fractal before the crossing of the MAs.
- Place the first Take Profit at the width of the SL. Try placing the second SL at the double width of the SL. Alternatively, use Trailing Stop for maximizing your profit.
An example of buying the index by the strategy
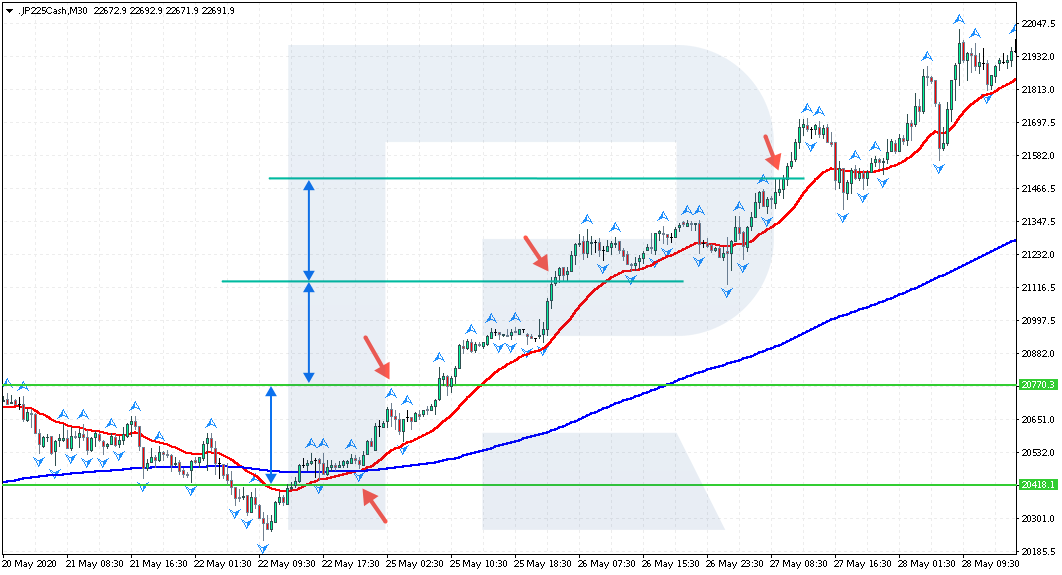
Let us have a look at an example. As you may see, after crossing, the fast Moving Average rests above the slow one. A fractal formed above the candlesticks – this is the first fractal after the crossing of the MAs. Place a pending order above the fractal at the price of 20770.

Place an SL at 20418 – below the last fractal and before the crossing of the MAs. Place the first TP at the distance equal to that between the entry point and the SL – this is the level of 21122. Close the second part of the position at 21474 or place a Trailing Stop. In our case, the movement was very strong, so both positions closed with a very good profit.
How to open a selling trade for Nikkei 225?
To open a successful selling trade for Nikkei 225 by the strategy, comply with the following requirements:
- EMA 25 has just broken EMA 195 from above and rests below it. This also indicates the beginning of a descending impulse.
- Fractals has formed under the candlesticks.
- Place a pending Sell Stop 2-5 points under the Fractals.
- Place an SL behind the nearest ascending fractal before the crossing of the MAs.
- Place the first TP at the width of the SL and the second one – at its double width or use Trailing Stop to maximize your profit.
An example of selling the index by the strategy
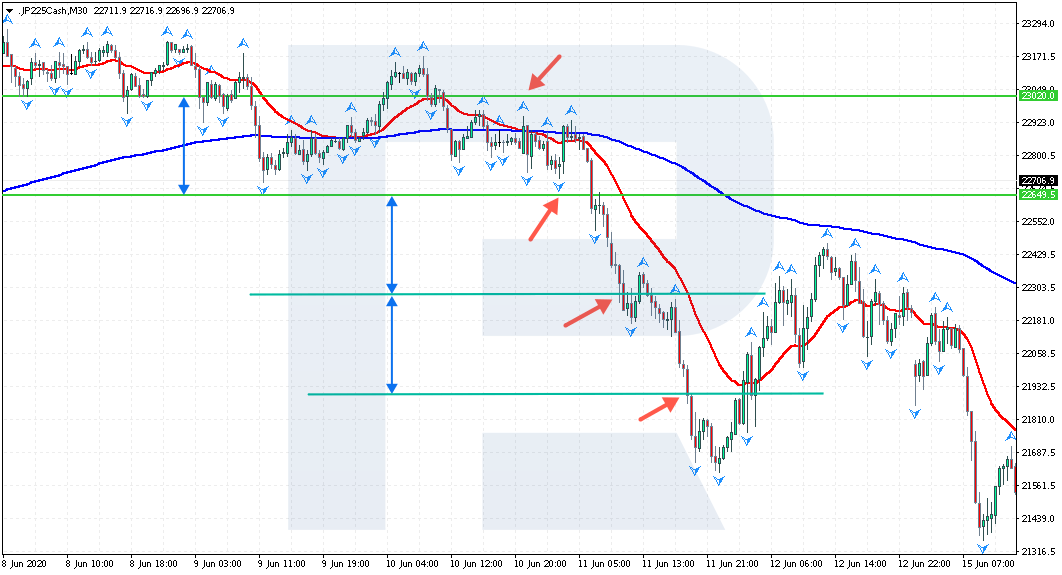
Let us have a look at an example of a selling trade that follows the buying one. As we can see, the MAs have crossed: the EMA 25 has crossed the EMA 195 from above and now rests under it. Find the first descending fractal and place a pending Sell Stop 2-5 points below the indicator at the price of 22649.

Place an SL at the level of 23020, above the last ascending fractal, and before the crossing of the MAs. Place the first TP at the distance that equals the distance between the entry point and the SL, which is the level of 22278. Close the second part of the position at the level of 21907 or use a Trailing Stop: the trade will close at the moment when the price reverses against us.
In this case as well, the movement downwards was quite strong, and both positions closed with a profit.
Summary

On the whole, trading Nikkei 225 does not differ much from trading other stock assets. Classic tech analysis works well here; you may also make a good profit using the levels and simple graphic patterns. Those who crave for trading indicators may use the strategy on M30 that we have just discussed.
The advantages of the strategy include simple and clear rules of entering and exiting the market. We trade the trend, and strong movements on the chart may bring us a good profit. Moreover, you may backtest the system and see how well it works in different circumstances.
Keep in mind that the strategy may be changed: you may add your instruments to make market entries more precise. All in all, this approach may be recommended to both beginners and those experts who have not traded Nikkei 225 yet.


