How to Trade by Day-Hour Strategy?

5 minutes for reading
Looking for signals on larger timeframes and then confirming them on smaller ones is quite a widespread strategy. Even in John Bollinger’s book on graphic patterns traders looked for graphic patterns in D1 charts and then switched to other TFs to wait for the same patterns to appear on them.
The Day-Hour trading strategy is exactly such a way of medium-term strategy, by which the trader searches for entry points on daily charts, then opens an H4 and assesses the strength of the signal on it. However, you do not need to look for any graphic patterns, as this type of trading is highly subjective: one trader sees one pattern, while another trader can see an absolutely different one at the same place of the chart.
By this strategy, the trader only cares for signals from technical indicators. This makes trading completely objective.
Which indicators to use for Day-Hour?
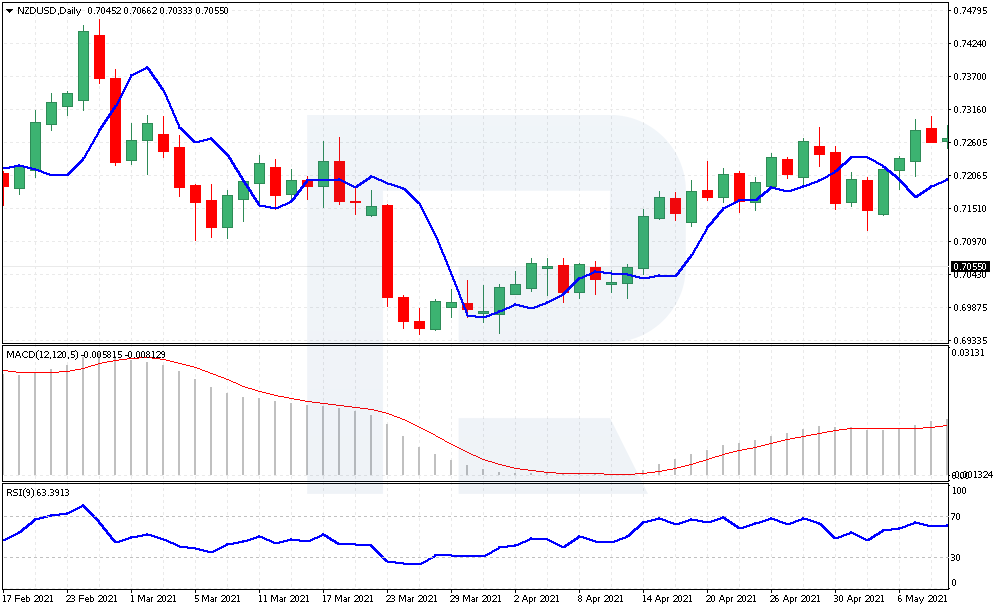
This strategy requires use of indicators. The first one is the usual Moving Average. The indicator is easy to use:
- If the price is above the Moving Average, then the trade is bullish, hence look for signals confirming the growth;
- If the price has dropped under the MA, the trend is bearish, and you need selling ideas.
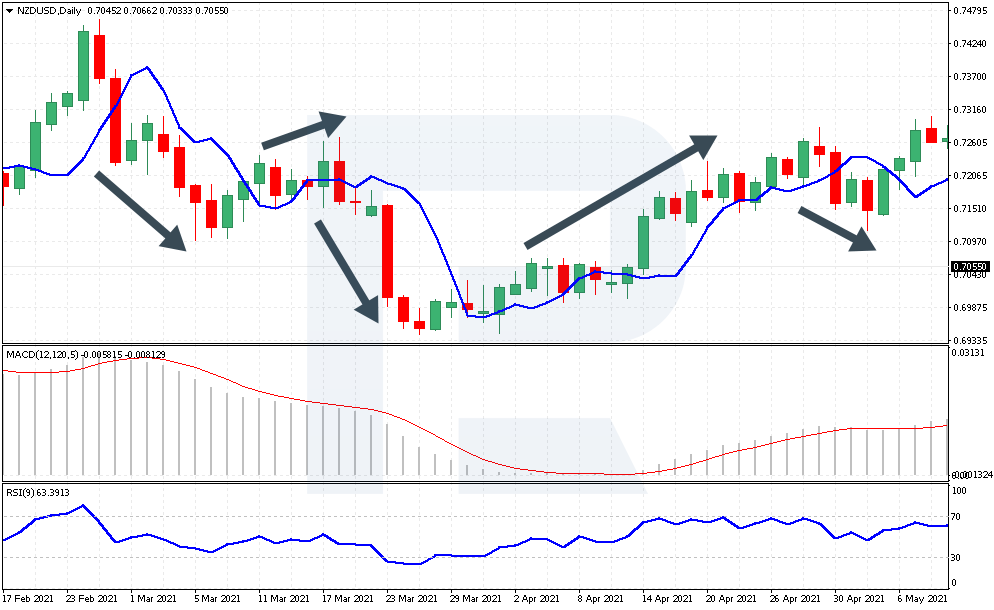
The other two indicators used in the strategy are oscillators: the MACD and RSI.
Most often, traders use a trend indicator and one or more oscillators to look for signals that confirm the trend.
All in all, add to the chart the following indicators:
- Moving Average (3). The “shift” parameter is also at 3. The line will be shifted three candlesticks to the right. This indicator is necessary on the daily chart.
- The MACD with the parameters 12, 120, 5. This is an indicator fir H4.
- The RSI with period 9. The overbought level is 70 and the oversold area is 30. This oscillator is also for H4.
All these indicators can be found in the standard settings of MetaTrader 4, MetaTrader 5, or R StocksTrader. This is a huge advantage as you do not need to download or install anything extra.
Opening a position by the Day-Hour strategy
To open any position, first consider the daily chart. If the closing price of the previous candlestick dropped below the MA, the asset is likely to drop. And if the price rose above the MA, count on growth. In case the price is wandering back and forth at the MA, skip such signals and wait for a clear breakaway.
To find some concrete signals, switch to H4 and check not only the MA, but also the MACD and RSI. For buying, the price must be above the MA. For selling – below it. In case of growth, the signal line breaks through the MACD upwards, and the RSI line is heading upwards. If we expect falling, the signal line of the MACD must break through the histogram downwards, and the RSI line must also be going down.
A buying trade by Day-Hour
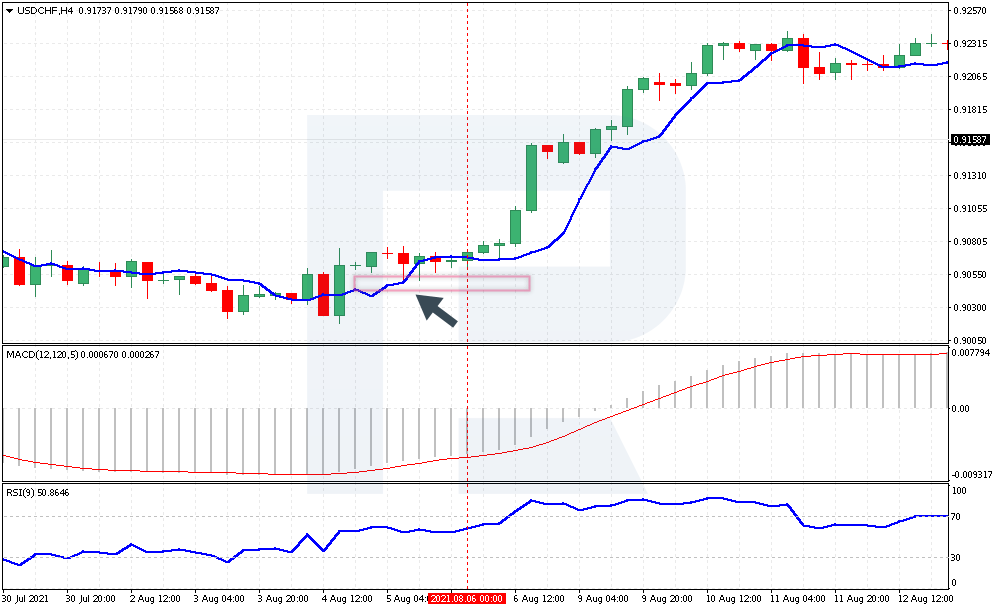
Take a look at an example of a buying trade by the strategy. Open a D1 of USD/CHF. The closing price has broken through the MA upwards.
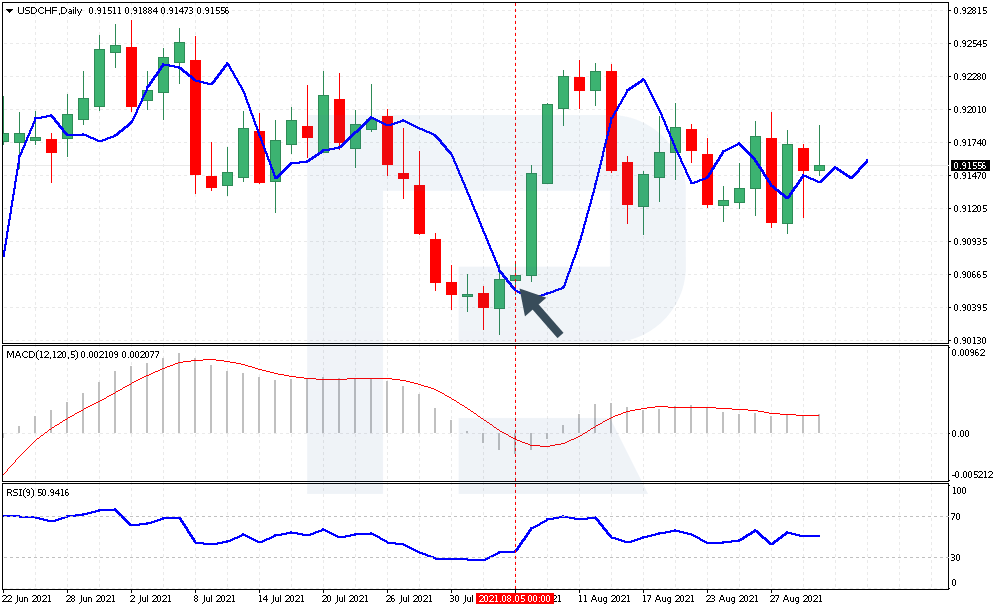
On the next trading day, switch to H4 and look at the situation in more detail:
- The price is above the MA, confirming a bullish impulse on H4 as well;
- The MACD histogram is going above the signal line, indicating the end of a recent downward movement;
- The RSI values are growing, not yet reaching 70, which means there is room for further growth.
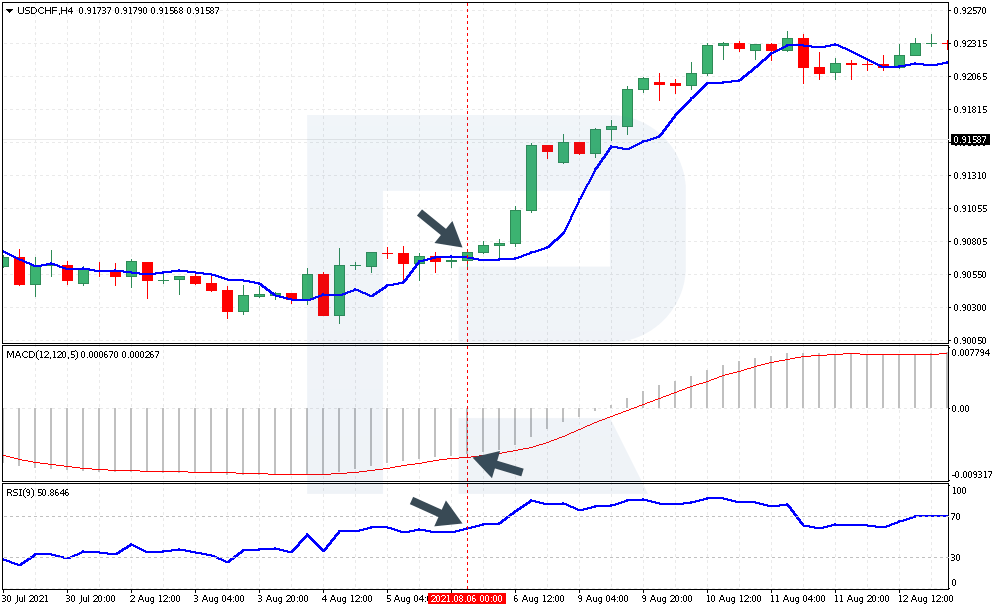
In our case, open a position at the price of 0.9070. The rules of the strategy do not include a Take Profit, so use a floating Stop Loss. One more option is placing a TP by a Fibo extension at 161.8, in this case – at 0.9115. The third option is a TP at the level of two SLs.
Place an SL behind the nearest support level or at the nearest price low, which is below 0.9045 in this case.
A selling trade by Day-Hour
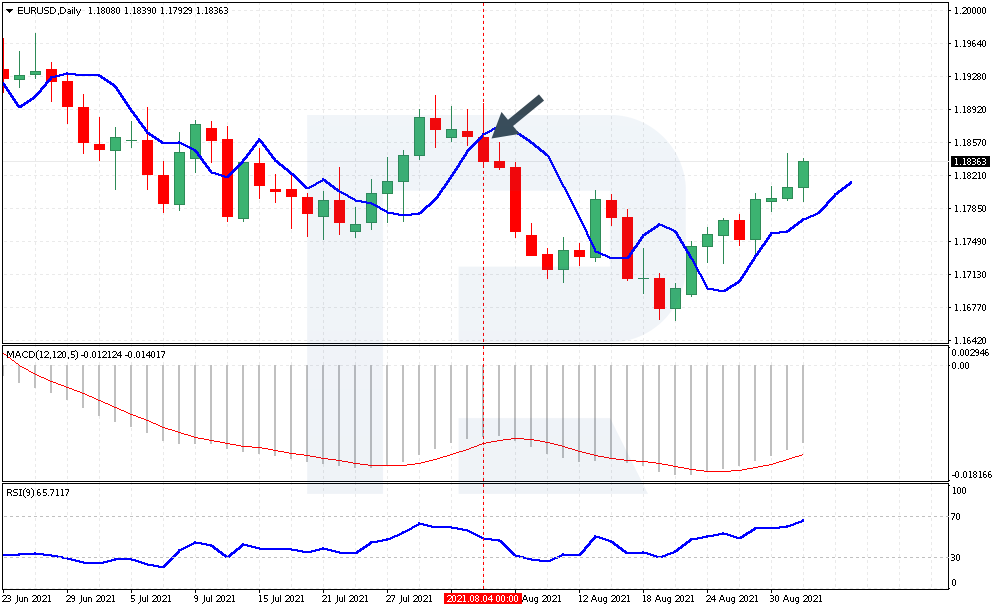
Now let us discuss a selling trade by the strategy on the example of the EUR/USD pair. Start with a D1. The closing price has broken the MA downwards.
When the next day opens, switch to H4 and look for confirmations of a sale:
- The price lies below the MA, which means on smaller TFs there is a bearish impulse as well.
- The MACD histogram is going below the signal line, which means the preceding growth is over.
- The RSI values are nearing 30 yet have not reached it, hence there is room for further falling.
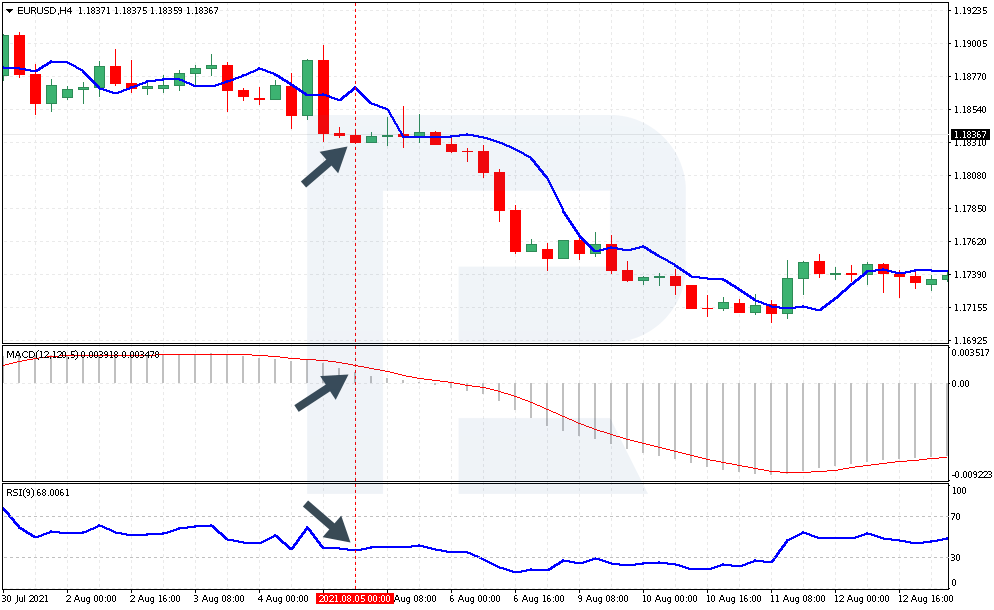
In our case, open a selling position at 1.1835. Place an SL behind the nearest resistance area at 1.1905.
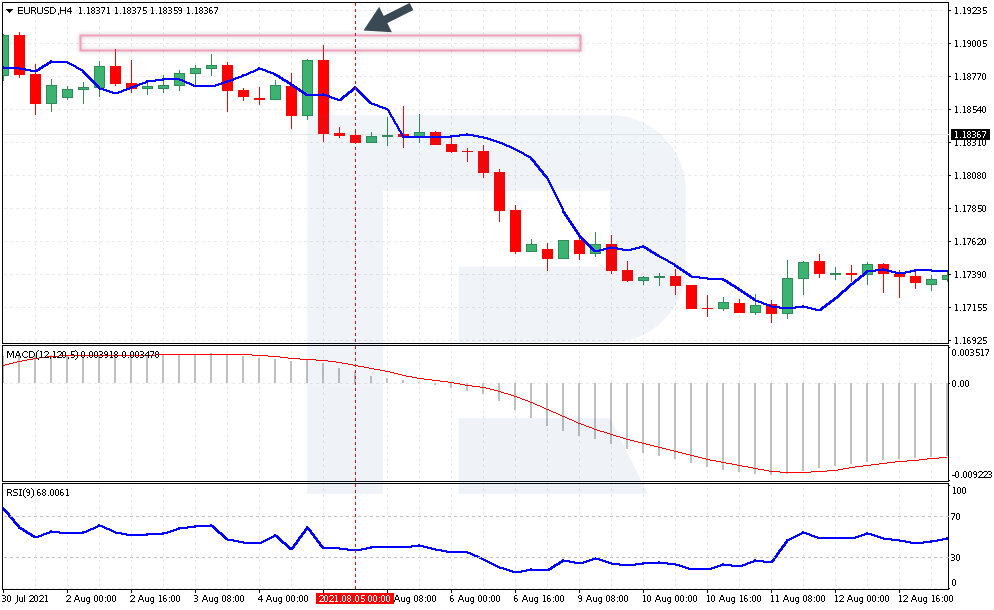
As noted above, there is no TP by the rules of the strategy, so either drag it after the price or use the options from the previous example.
Closing thoughts
The Day-Hour strategy is meant for trading the trend, as one of the main traders’ rules goes. For a decent market entry, the strategy implies analyzing both D1 and H4 of the instrument. This method decreases risks and gives a chance a catch a good movement on the D1.
The drawback of the strategy is that it remains valid only when there is a good movement on the chart. When the price is in a flat, the trader will constantly be seeing breakaways of the MA up and down, which might entail a series of bad trades. On the other hand, opening a position by a trend that is just beginning, you never know what levels it might reach.


