MACD + ADX Trading Strategy

5 minutes for reading
The name of the article clearly indicates that the latter is devoted to a strategy that uses two indicators: ADX and the MACD oscillator. To be short, I will be calling it MACD+ADX. Some say that a trend indicator alongside an oscillator is the most efficient combo.
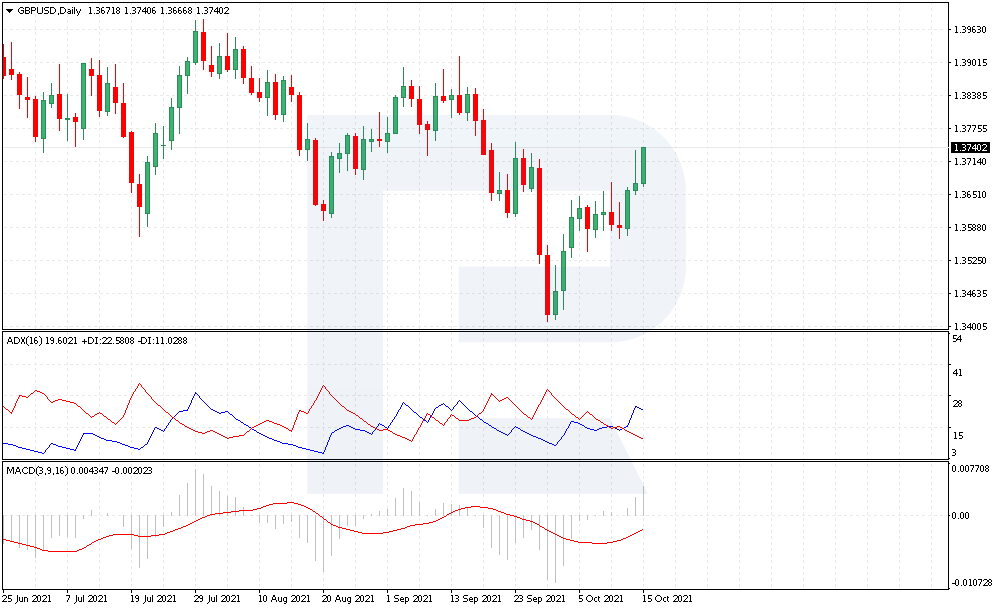
The strategy is meant for day charts of currency pairs, which means less time spent on graphic analysis than with shorter timeframes. Any of these three pair suits the strategy: EUR/USD, GBP/USD, AUD/USD. Experienced investors stick to these ones because majors have more predictable behavior, and tech analysis works much better on them.
In the article I will show you how to combine signals from the two indicators correctly and will reveal some nuances and rules of work by the strategy.
MACD+ADX description
To open a position, start by analyzing the activity of ADX with period 16. Make sure you choose correct settings when adding the indicator to the trading terminal.
Signals in the strategy do not differ from "classic" ADX signals. As you know, the author claims that a crossing of +Di and -Di as it is already gives a market entry signal. For example, if +Di crosses -Di from below, this is a signal to buy, and if -Di crosses +Di from above, this signals to sell.
+Di and -Di show the difference between today's and yesterday's high and low. So in the first case, when +Di goes up, the trend must be ascending because today's highs are higher than yesterday's. Hence, buying is the best option in such circumstances. Meanwhile, when -Di values go down, we can conclude there is a bearish impulse and get prepared for selling.
MACD is one of the most widespread and popular oscillators. As a rule, it is used for finding divergences, but in our case only the position of the histogram above or below zero matters because it is used as a filter for opening signals. Rising above zero, the histogram indicates a bullish trend and falling below zero — a bearish one.
To work by the strategy, change the MACD settings for 3, 9, 16
Now let us find out how to open positions by the strategy.
How to open a buying position by MACD+ADX
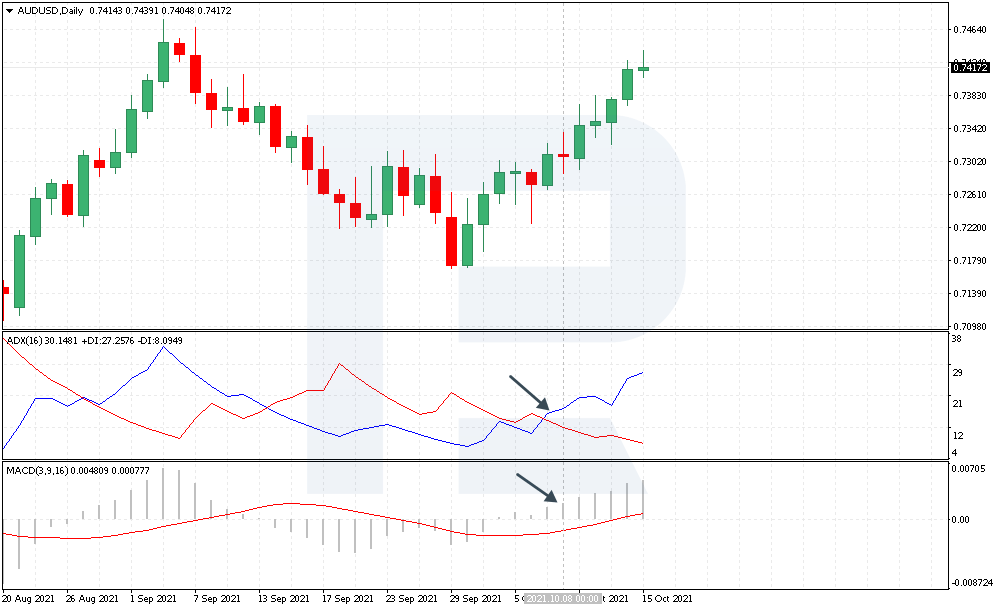
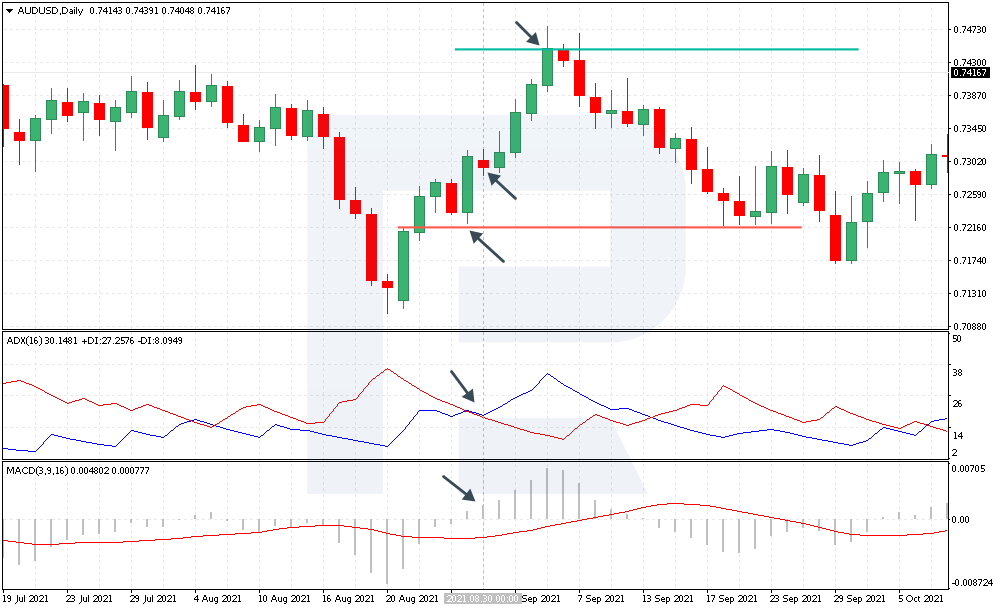
As an example, let us have a look at several signals on D1 of AUD/USD.To open a buying position, we need the MACD histogram to be above zero. Then check the signal lines of ADX: +Di must be above -Di.
As you can see, in our example MACD values are indeed above zero, and ADX lines have crossed in favor of price growth. You can open a buying position.

Stop Loss should be placed below the low of the preceding daily candlestick. In our example, one should buy at the opening of the trading day on October 8th, 2021, placing a Stop Loss below 0.7255. By the strategy, try to use Trailing Stop because the price will be going in our direction with a step of 40-70 points.
As a simple option of Take Profit placement try a 1 to 2 ration. So, if you have a Stop Loss sized 50 points, place a Take Profit at 100 points from the entry point.
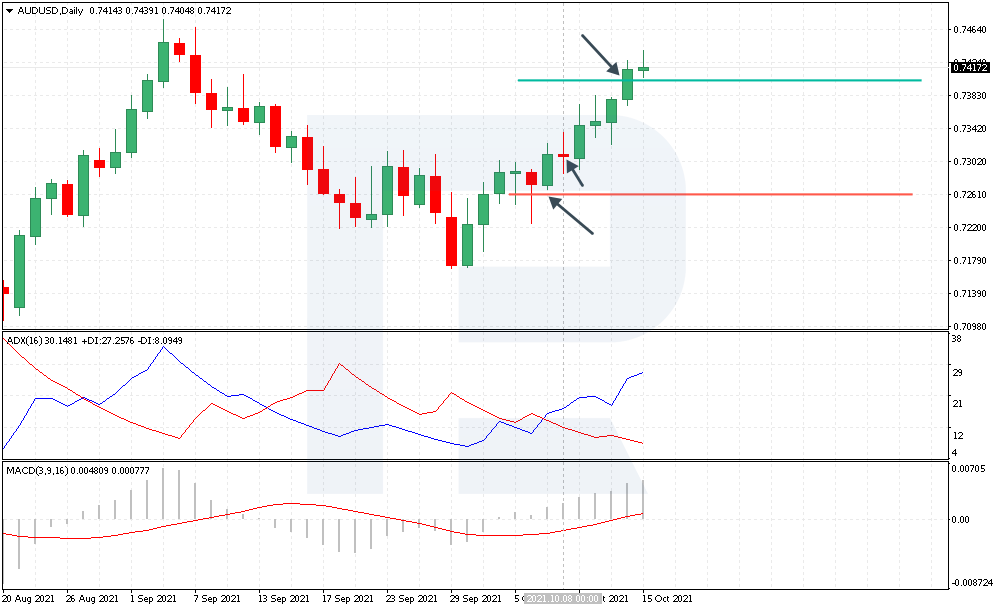
Previous such signal was seen on the chart on August 30th, 2021. It was also by the strategy rules: MACD values above the signal line, +Di had secured above -Di. One could open a buying position at 0.7290.
Stop Loss was to be placed below the low of the preceding candlestick. We can see impressive growth there, so the Stop Loss was to be above average, placed at 0.7215, i.e. sized 75 points. Take Profit was to be sized 150 points at 0.7440. As you can see, the price reached the goal.
However, your trades can be faulty, so never neglect money management rules. Always place a Stop Loss and control risks.


How to open a selling position by MACD+ADX
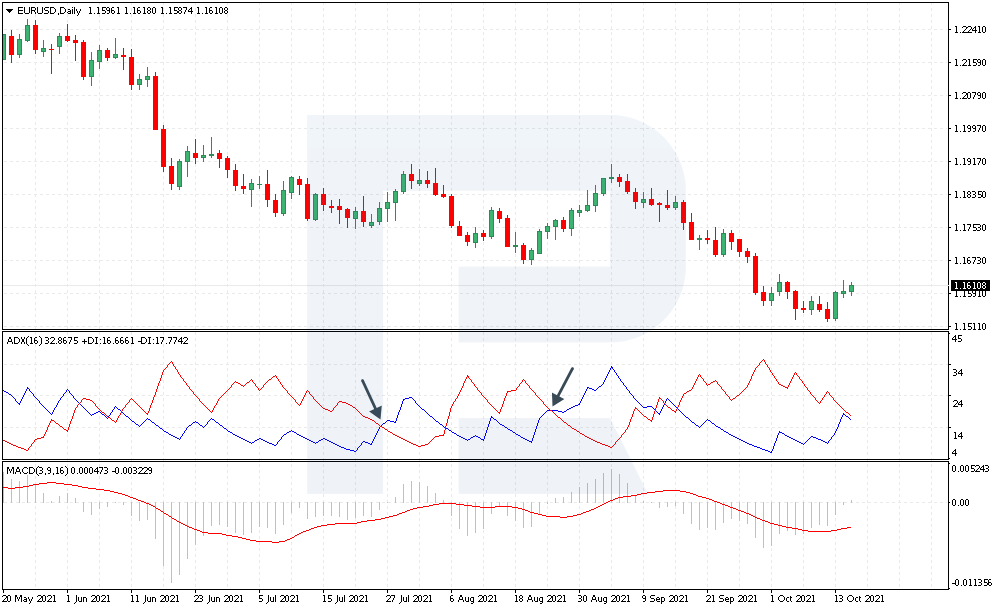
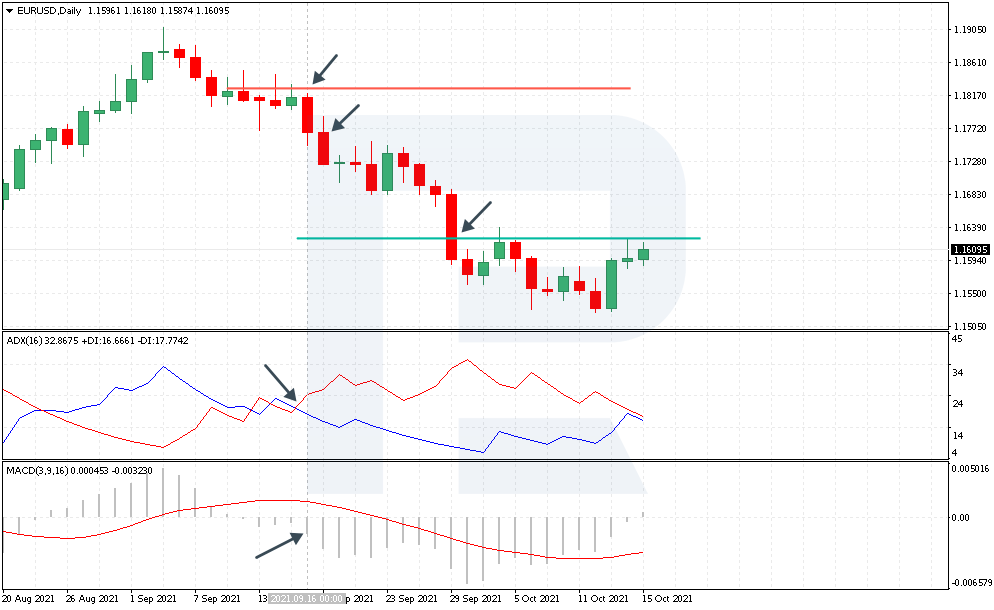
Now let us talk about a selling trade. Take a look at the last trade by EUR/USD. On the whole, the trend is descending. MACD values dropped below zero. At the same moment -Di rose above +Di, which created a signal to sell the pair.
Open a position at 1.1760. Place a Stop Loss above the high of the preceding candlestick at 1.1825. Hence, you risk 70 points, so the Take Profit should be sized 140 points, placed at 1.1620. As we can see, the price later reached that level.
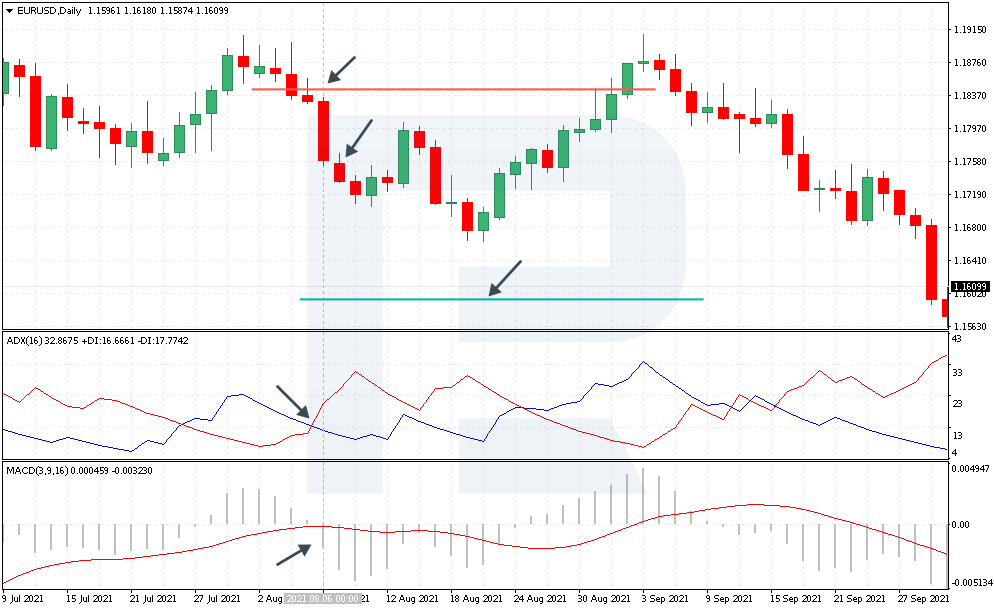
However, I have an example of a faulty trade as well. A signal was received on August 6th, 2021. MACD values dropped below zero, while -Di secured above +Di, which suggested opening a selling position at 1.1760.
Stop Loss was placed at 1.1845 and Take Profit — at 1.1590. The price never reached this level but later grew even higher, moreover, the strategy gave a signal to buy. Hence, trading by MACD+ADX, always stick to your money management rules.
Closing thoughts
A daily strategy MACD+ADX has clear and simple rules of work. These indicators are available in the standard set of the most popular trading platforms and give bright entry and exit signals.
You trade by the trend, which is a great advantage for both a beginner and an expert. Meanwhile, work on D1 allow for shortening the time spent on chart analysis and decreasing the overall number of trades.
At the same time, work on a higher timeframe requires more concentration and patience while you are waiting for good signals.