Trading by Channel Scalping Strategy

7 minutes for reading
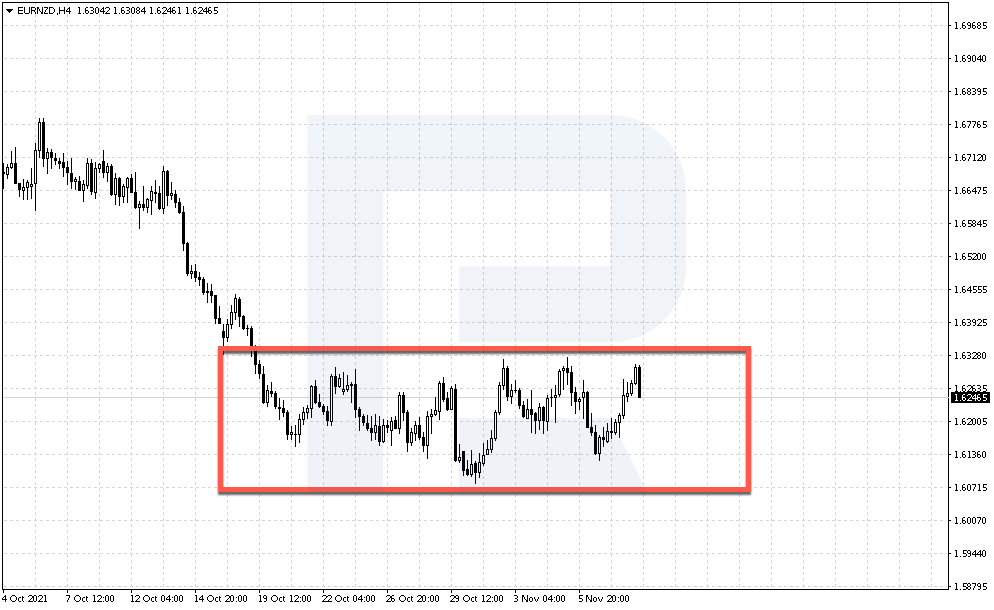
The ordinary idea of a "channel" in financial markets is a price movement in a flat that has a clear upper and lower border. In such a case, traders either check for a bounce off the borders of the channel, or a breakaway in this or that direction and thus assess the potential of further price movements.
In the Channel strategy, Moving Averages are used for setting this range. As the authors of the strategy say, those help find the beginning of the trend. The trader only needs to follow the trend by the rules.
In this article, you will see how to see such a channel in Moving Averages and trade by the trend on small timeframes that are just beginning.
Description of the Channel strategy
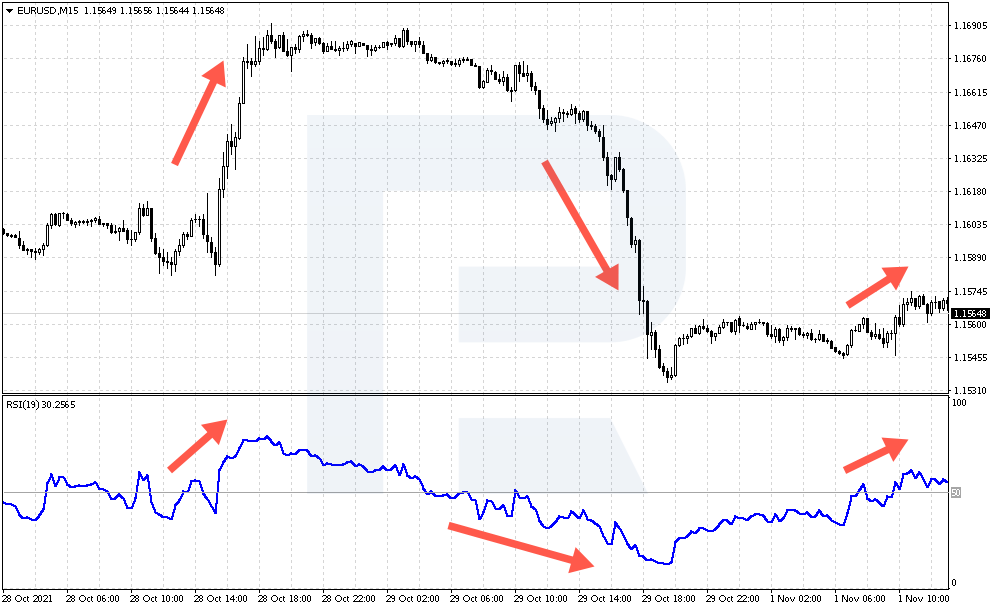
At the base of this strategy, apart from Moving Averages, lies RSI. This is an oscillator that shows the force of the trend.
When the values of the indicator rise above the level of 50, we can conclude that bulls are stronger than bears, and the price is likely to go further upwards. However, if the price drops below 50, the bearish trend will probably stay.
Many investors think that this combination of trend indicators and oscillators is the best for trading.
The channel is set by two MAs out of the four used in the strategy. A breakaway of these MAs signals the beginning of a trend, while the two remaining ones will show where to enter the market at the breakaway.


Setting up the strategy
To set up the strategy, add all the indicators to the chart of the instrument. Let us look at the parameters in detail.
Add and set up the MAs:
- Exponential Moving Average (EMA), period 16, color red.
- EMA, period 30, also red.
- Linear weighted MA (WMA), period 5, color pink.
- WMA, period 12,color green.
Then add the oscillator:
- Relative Strength indicator (RSI), period 19, add level 50.
Moving Averages and RSI are there in the standard set of built-in indicator for the popular platforms MetaTrader 4 and MetaTrader 5.
Trading takes place on M15 but you can try using it on larger timeframes, such as M30 and H1. The Channel is a short-term strategy for intraday trading, so if you choose M15, you can get several signals on it during the day.
The main advantage of the Channel is the fact that the trader does not have to predict where the price will go, they just follow its movements.
To some extent, this strategy can be compared to the Breaking Volatility strategy, where investors wait for the maximal lull of activity in the market with a forming channel that will give an entry signal in case broken away. However, this is a separate topic.
How to trade by the Channel
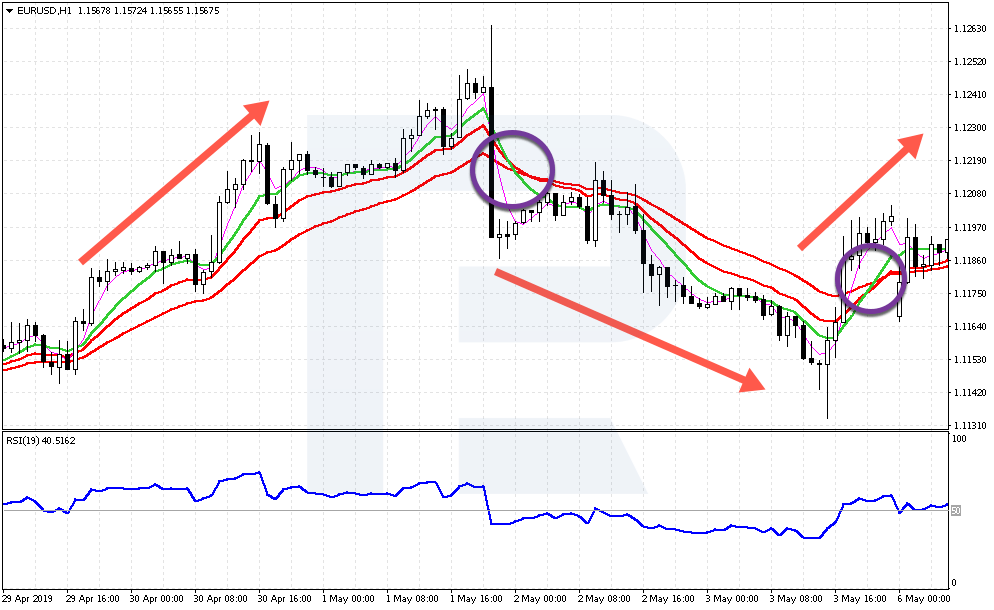
First of all, wait for the red EMAs with periods 16 and 30 to become horizontal. Then wait for the WMAs 5 and 12 to cross the two remaining lines. If the breakaway happens from above, this signals to sell because a bearish momentum is to form. Also, take a look at the behavior of RSI: its values must be below 50.
If the EMA 16 and 30 lines are broken from below, then buy and wait for a bullish momentum to form. Always check the RSI position: the values must be above 50, which will confirm the potential movement upwards.
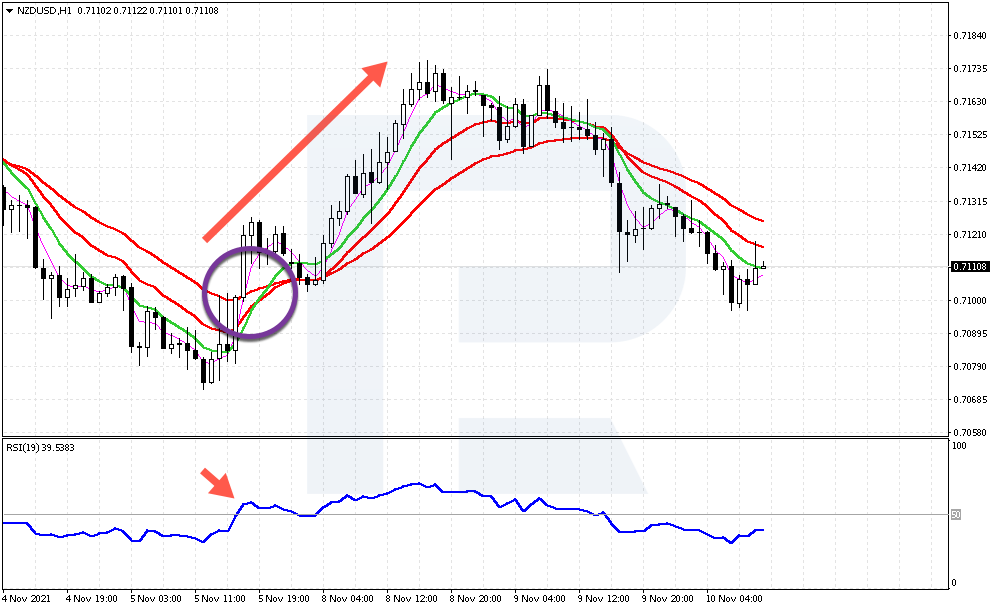
A buying trade
Look at an example of a buying trade with NZD/USD. The price goes under the EMAs and tries to break through them upwards. After one more such movement, the price manages to secure above the MAs.
Then WMAs 5 and 12 also break through the main EMA 16 and 30 lines upwards, which signals to open a buying position. Check for the RSI position: in our case, it is above 50.
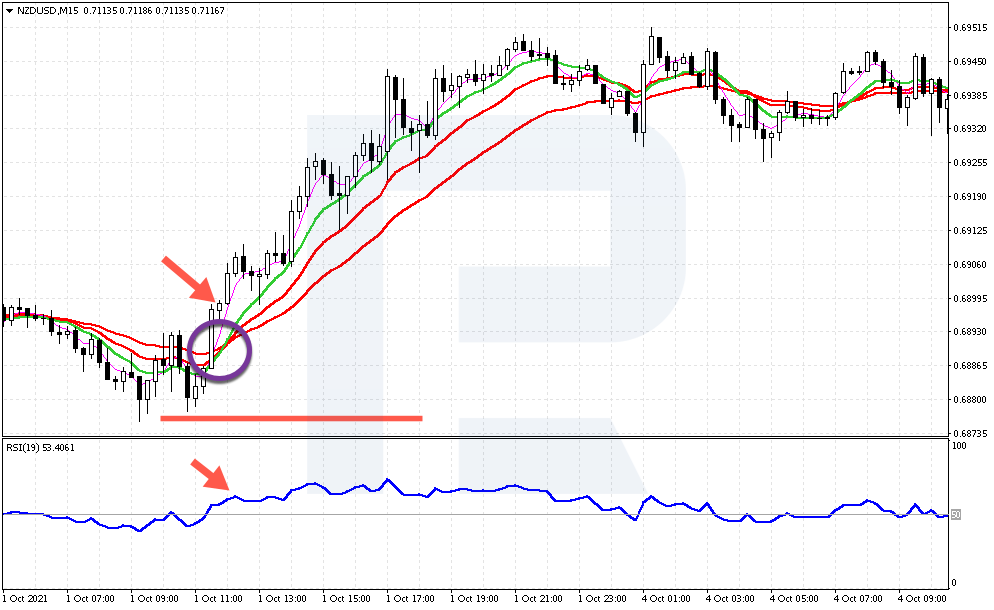
The authors of the strategy note that if the fastest WMA 5 crosses the red lines much earlier than the WMA 12, this is a strong entry signal.
In our example, a buying position can be opened at the price of 0.6898, where we saw all the crossings. Unfortunately, the strategy does not suggest any rules for the Stop Loss, yet it is too risky to trade without it, as you know.
Hence, in the example above, a good variant of the Stop Loss can be the order placed behind the low of the candlestick before the crossing of the lines. This will be behind 0.6875
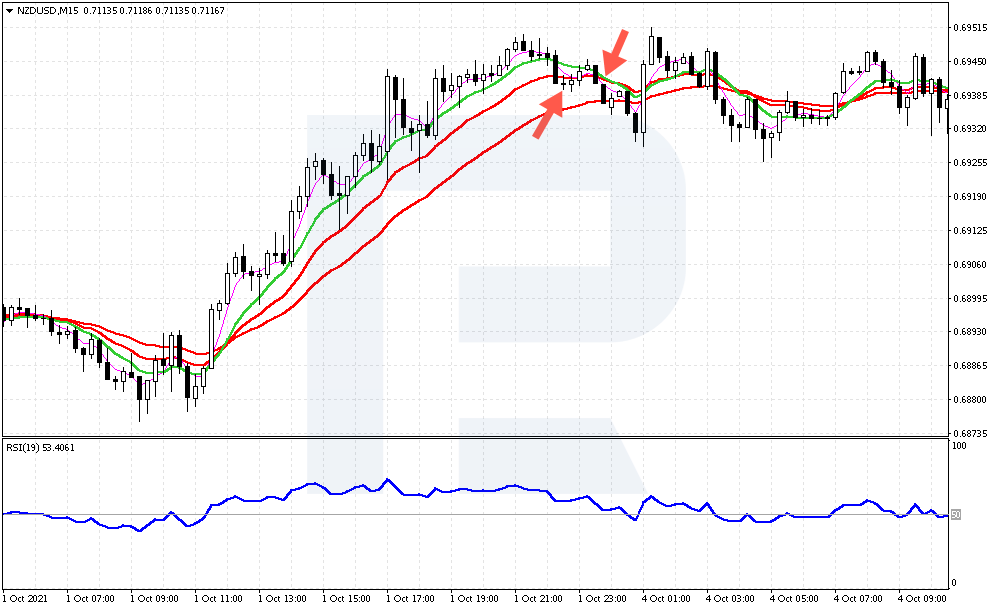
Close your position when the fast WMA crosses a red MA: either at a test of this line or at a breakaway be the candlestick downwards.
In our example, maximum profit was 52 pips, and the position was closed with a profit of 38 pips. The SL was sized 20 pips, which was almost 2 times smaller than the potential profit of the trade. This is in compliance with the rules of risk management, where the risk to profit ratio is recommended to be 1:2.
Selling trade
Now let us discuss an example of a selling trade in EUR/USD. The price has been moving in a sideways correction for some time. At a certain point, the price broke through the red MAs downwards quite confidently, and the candlestick also closes under these lines.
There is a clear crossing of EMA 16 and 30, as well as a breakaway of these lines by WMA 5 and 12. RSI values are below 50, which is yet another signal to sell the EUR/USD pair at 1.1676.
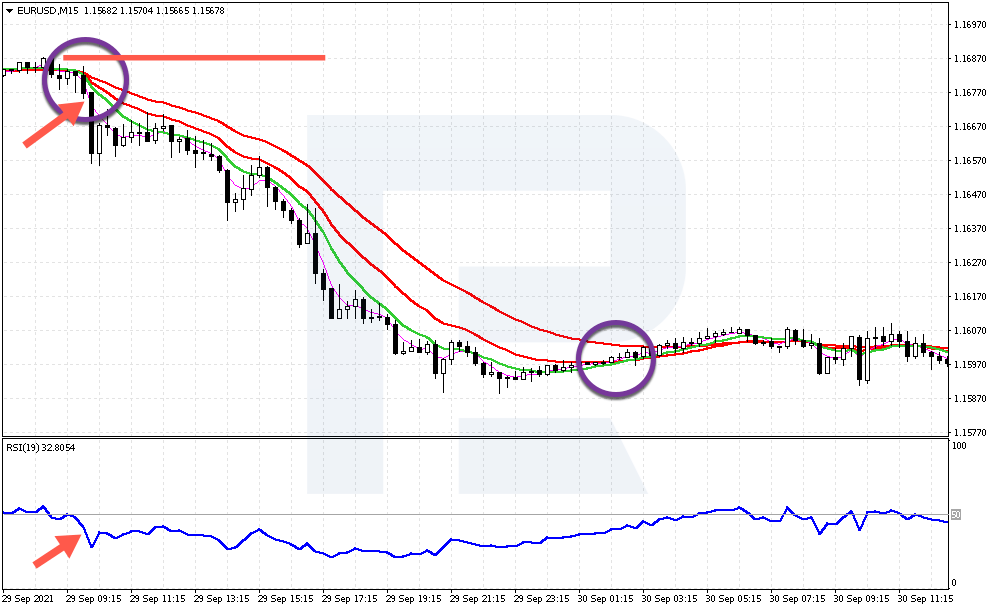
An SL is placed above the high and before the crossing of the lines at 1.1689: this gives us a risk of 13 pips.
As you see, WMA 5 broke through the red line at 1.1600 only. So, theoretically the profit could reach 76 pips. Maximum high reached 88 pips. In this example, the profit is several times larger than the risk, which is great.
Advice on trading by the Channel
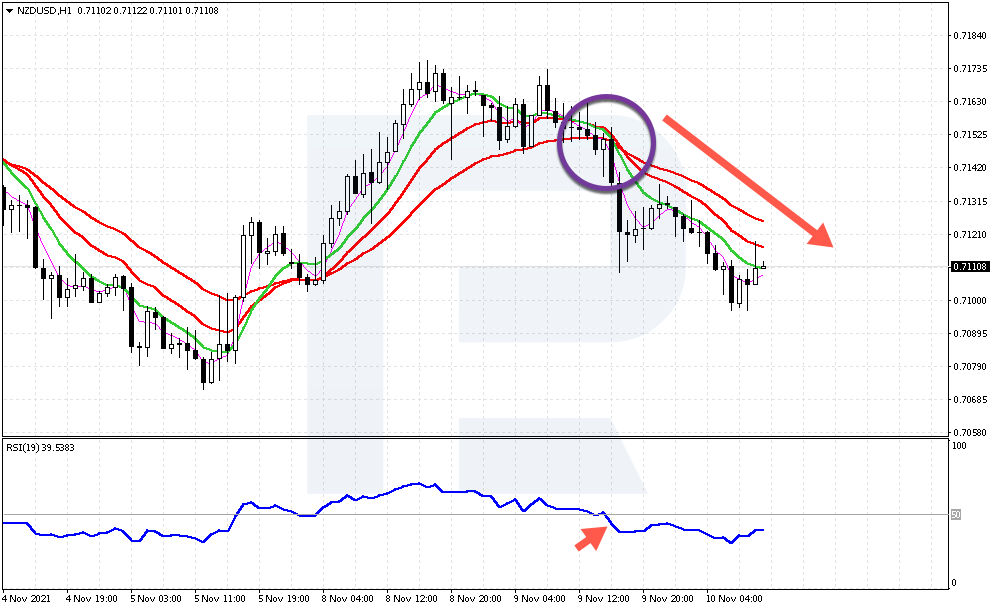
- Mind that not all the signals by the strategy will yield any market results. If the price reverses and breaks through all MAs in the opposite direction, close your position.
- The market might get stuck in lengthy flats, so the strategy will be generating false signals. The price will be breaking through the MAs up and then down at once. Try placing your SL at the entry point to minimize losses.
- The distance between the two red MAs might indicate the force of the trend: the bigger the distance, the stronger the impulse. If the channel narrows, it might signal about a sliw-down or a reversal of the trend.
Bottom line
The Channel trading strategy is a mixture of MAs with different periods. Using them — the authors state — the trader can catch the beginning of a new trend and trade it. Additional signals are given by the RSI oscillator that filters signals from the strategy, so that the investor could not open unconfirmed trades.
For many traders, the MA is the best indicator for finding the trend. However, it has serious drawbacks: the lines lag quite a bit, and in flats, they give many false signals.
If the trader is aware of these drawbacks, they can use the Channel freely. Moreover, risks on M15 are minimal.


